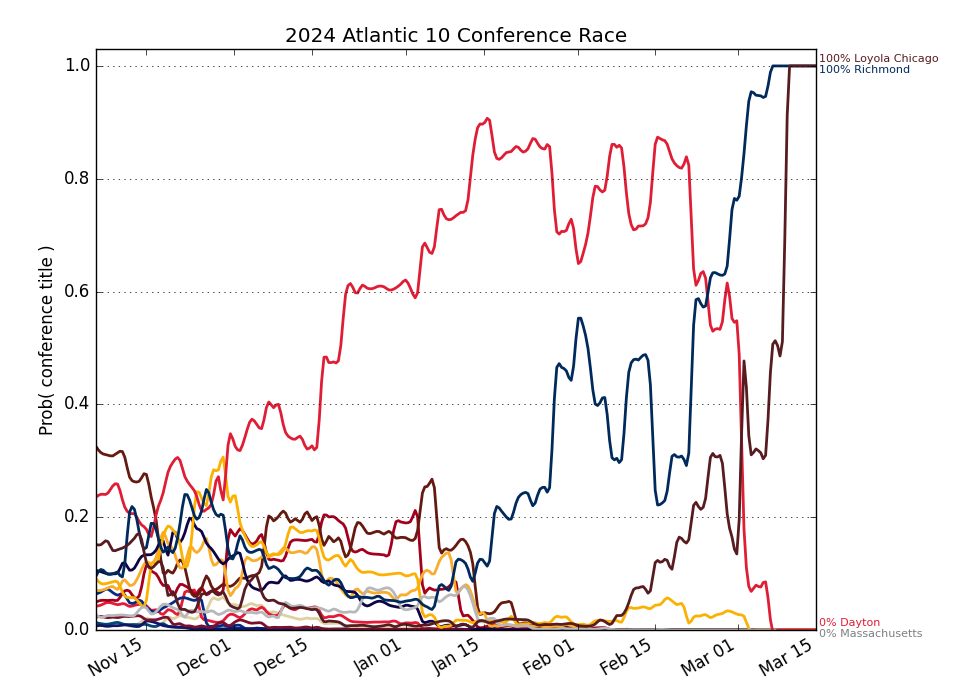
Atlantic 10
Updated with games through Friday, March 27
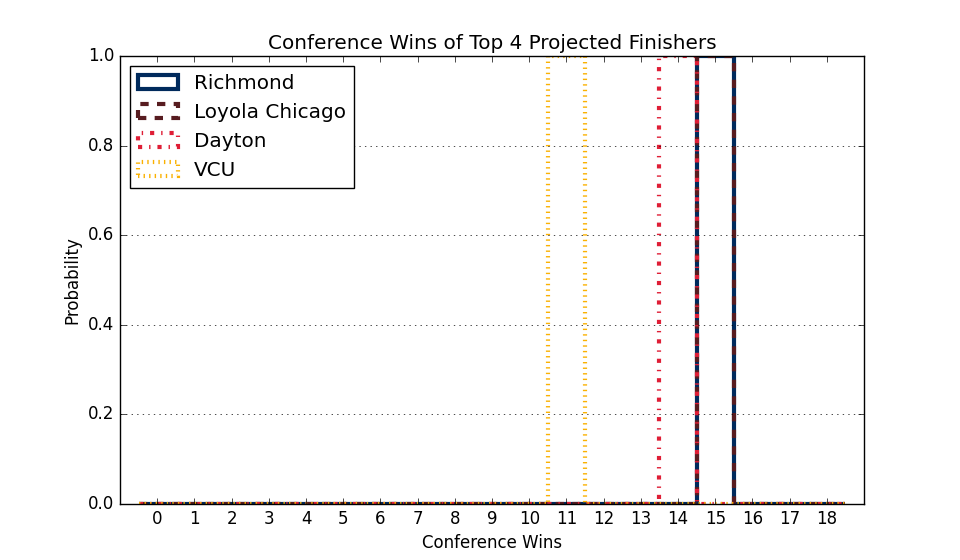
Conference Projections
Based on 10,000 simulations of the remaining season.
Tiebreaking was done using the
Big Ten tiebreaking procedures.
| Atlantic 10 |
Current Record |
Projected Record |
Projected Finish (% odds, with tiebreakers) |
|
Team |
Conf. |
Overall |
Conf. |
Overall |
1st | 2nd | 3rd | 4th | 5th | 6th | 7th | 8th | 9th | 10th | 11th | 12th | 13th | 14th |
| 1. |
VCU (50) |
18 - 3 |
28 - 8 |
18.0 - 3.0 |
28.0 - 8.0 |
100.0 | | | | | | | | | | | | | |
| 2. |
Saint Louis (32) |
16 - 4 |
28 - 6 |
16.0 - 4.0 |
28.0 - 6.0 |
| 100.0 | | | | | | | | | | | | |
| 3. |
Saint Joseph's (128) |
14 - 6 |
22 - 12 |
14.0 - 6.0 |
22.0 - 12.0 |
| | 100.0 | | | | | | | | | | | |
| 4. |
Dayton (79) |
14 - 7 |
25 - 12 |
14.0 - 7.0 |
25.0 - 12.0 |
| | | 100.0 | | | | | | | | | | |
| 5. |
George Mason (102) |
11 - 8 |
22 - 10 |
11.0 - 8.0 |
22.0 - 10.0 |
| | | | 100.0 | | | | | | | | | |
| 6. |
Davidson (120) |
11 - 9 |
18 - 14 |
11.0 - 9.0 |
18.0 - 14.0 |
| | | | | 100.0 | | | | | | | | |
| 7. |
Duquesne (143) |
10 - 10 |
16 - 15 |
10.0 - 10.0 |
16.0 - 15.0 |
| | | | | | 100.0 | | | | | | | |
| 8. |
George Washington (90) |
9 - 11 |
18 - 16 |
9.0 - 11.0 |
18.0 - 16.0 |
| | | | | | | 100.0 | | | | | | |
| 9. |
Fordham (172) |
8 - 11 |
14 - 15 |
8.0 - 11.0 |
14.0 - 15.0 |
| | | | | | | | 100.0 | | | | | |
| 10. |
Rhode Island (153) |
7 - 12 |
16 - 16 |
7.0 - 12.0 |
16.0 - 16.0 |
| | | | | | | | | 100.0 | | | | |
| 11. |
St. Bonaventure (146) |
6 - 15 |
16 - 17 |
6.0 - 15.0 |
16.0 - 17.0 |
| | | | | | | | | | 100.0 | | | |
| 12. |
Richmond (152) |
5 - 14 |
14 - 17 |
5.0 - 14.0 |
14.0 - 17.0 |
| | | | | | | | | | | 100.0 | | |
| 13. |
La Salle (248) |
5 - 14 |
8 - 23 |
5.0 - 14.0 |
8.0 - 23.0 |
| | | | | | | | | | | | 100.0 | |
| 14. |
Loyola Chicago (279) |
5 - 15 |
9 - 24 |
5.0 - 15.0 |
9.0 - 24.0 |
| | | | | | | | | | | | | 100.0 |
Weekly Changes |
| 1. |
VCU (50) |
|
+0.0 | +0.0 | +0.0 | +0.0 | +0.0 | +0.0 | +0.0 | +0.0 | +0.0 | +0.0 | +0.0 | +0.0 | +0.0 | +0.0 |
| 2. |
Saint Louis (32) |
|
+0.0 | +0.0 | +0.0 | +0.0 | +0.0 | +0.0 | +0.0 | +0.0 | +0.0 | +0.0 | +0.0 | +0.0 | +0.0 | +0.0 |
| 3. |
Saint Joseph's (128) |
|
+0.0 | +0.0 | +0.0 | +0.0 | +0.0 | +0.0 | +0.0 | +0.0 | +0.0 | +0.0 | +0.0 | +0.0 | +0.0 | +0.0 |
| 4. |
Dayton (79) |
|
+0.0 | +0.0 | +0.0 | +0.0 | +0.0 | +0.0 | +0.0 | +0.0 | +0.0 | +0.0 | +0.0 | +0.0 | +0.0 | +0.0 |
| 5. |
George Mason (102) |
|
+0.0 | +0.0 | +0.0 | +0.0 | +0.0 | +0.0 | +0.0 | +0.0 | +0.0 | +0.0 | +0.0 | +0.0 | +0.0 | +0.0 |
| 6. |
Davidson (120) |
|
+0.0 | +0.0 | +0.0 | +0.0 | +0.0 | +0.0 | +0.0 | +0.0 | +0.0 | +0.0 | +0.0 | +0.0 | +0.0 | +0.0 |
| 7. |
Duquesne (143) |
|
+0.0 | +0.0 | +0.0 | +0.0 | +0.0 | +0.0 | +0.0 | +0.0 | +0.0 | +0.0 | +0.0 | +0.0 | +0.0 | +0.0 |
| 8. |
George Washington (90) |
|
+0.0 | +0.0 | +0.0 | +0.0 | +0.0 | +0.0 | +0.0 | +0.0 | +0.0 | +0.0 | +0.0 | +0.0 | +0.0 | +0.0 |
| 9. |
Fordham (172) |
|
+0.0 | +0.0 | +0.0 | +0.0 | +0.0 | +0.0 | +0.0 | +0.0 | +0.0 | +0.0 | +0.0 | +0.0 | +0.0 | +0.0 |
| 10. |
Rhode Island (153) |
|
+0.0 | +0.0 | +0.0 | +0.0 | +0.0 | +0.0 | +0.0 | +0.0 | +0.0 | +0.0 | +0.0 | +0.0 | +0.0 | +0.0 |
| 11. |
St. Bonaventure (146) |
|
+0.0 | +0.0 | +0.0 | +0.0 | +0.0 | +0.0 | +0.0 | +0.0 | +0.0 | +0.0 | +0.0 | +0.0 | +0.0 | +0.0 |
| 12. |
Richmond (152) |
|
+0.0 | +0.0 | +0.0 | +0.0 | +0.0 | +0.0 | +0.0 | +0.0 | +0.0 | +0.0 | +0.0 | +0.0 | +0.0 | +0.0 |
| 13. |
La Salle (248) |
|
+0.0 | +0.0 | +0.0 | +0.0 | +0.0 | +0.0 | +0.0 | +0.0 | +0.0 | +0.0 | +0.0 | +0.0 | +0.0 | +0.0 |
| 14. |
Loyola Chicago (279) |
|
+0.0 | +0.0 | +0.0 | +0.0 | +0.0 | +0.0 | +0.0 | +0.0 | +0.0 | +0.0 | +0.0 | +0.0 | +0.0 | +0.0 |
This table gives the probability of earning at least a share of a given place.
So there are no tiebreakers and there can be multiple first place teams, for example.
This Week's Games
| Date |
Away |
W Prob, Pred Score |
Home |