ACC
Updated with games through Friday, March 27
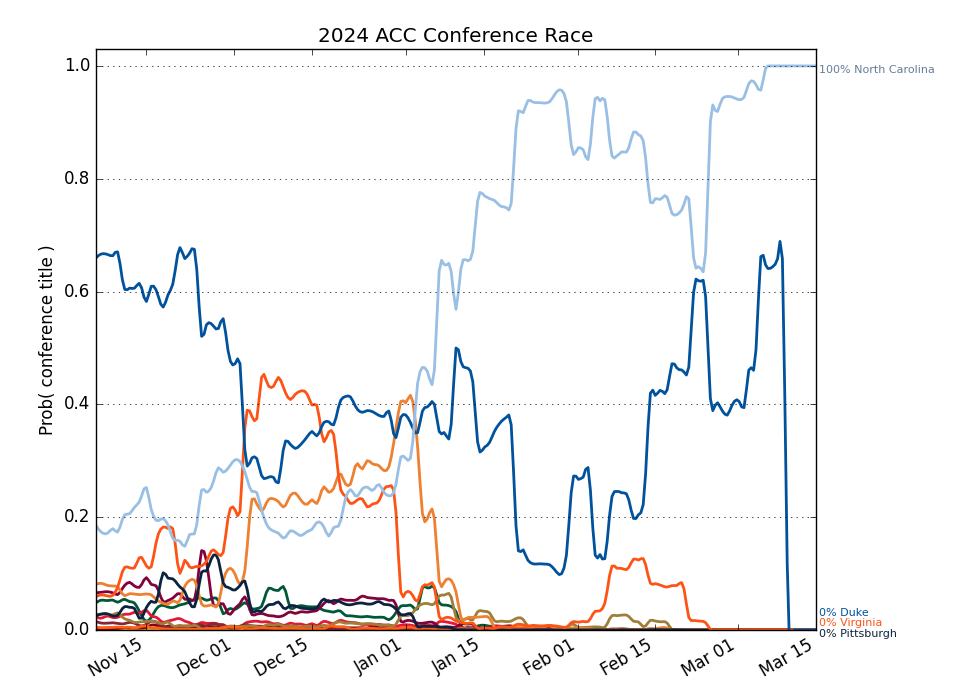
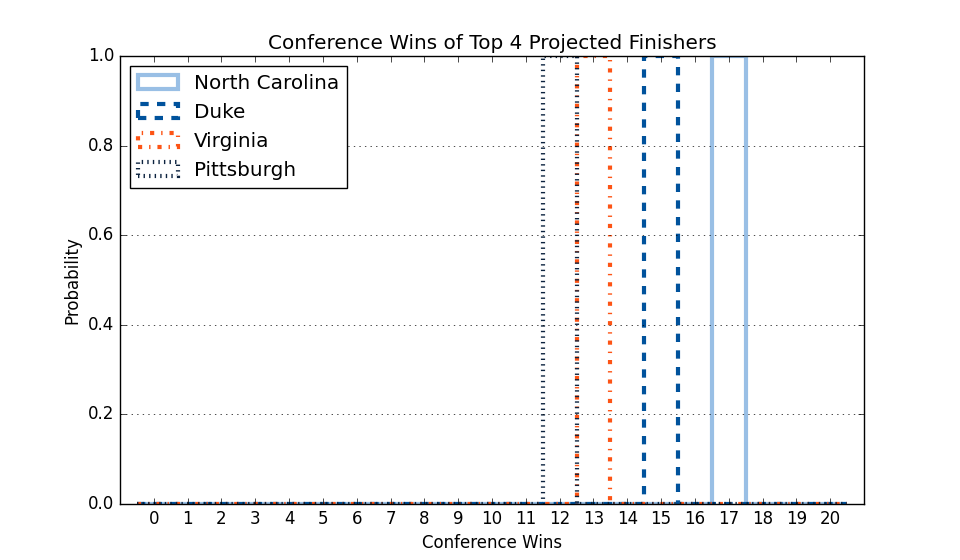
Conference Projections
Based on 10,000 simulations of the remaining season.
Tiebreaking was done using the
Big Ten tiebreaking procedures.
| ACC |
Current Record |
Projected Record |
Projected Finish (% odds, with tiebreakers) |
|
Team |
Conf. |
Overall |
Conf. |
Overall |
1st | 2nd | 3rd | 4th | 5th | 6th | 7th | 8th | 9th | 10th | 11th | 12th | 13th | 14th | 15th | 16th | 17th | 18th |
| 1. |
Duke (1) |
20 - 1 |
35 - 2 |
20.0 - 1.0 |
35.0 - 2.0 |
100.0 | | | | | | | | | | | | | | | | | |
| 2. |
Virginia (22) |
17 - 4 |
29 - 7 |
17.0 - 4.0 |
29.0 - 7.0 |
| 100.0 | | | | | | | | | | | | | | | | |
| 3. |
Miami FL (31) |
14 - 6 |
26 - 9 |
14.0 - 6.0 |
26.0 - 9.0 |
| | 100.0 | | | | | | | | | | | | | | | |
| 4. |
Clemson (39) |
14 - 7 |
24 - 11 |
14.0 - 7.0 |
24.0 - 11.0 |
| | | 100.0 | | | | | | | | | | | | | | |
| 5. |
North Carolina (28) |
12 - 7 |
24 - 9 |
12.0 - 7.0 |
24.0 - 9.0 |
| | | | 100.0 | | | | | | | | | | | | | |
| 6. |
Louisville (17) |
12 - 8 |
24 - 11 |
12.0 - 8.0 |
24.0 - 11.0 |
| | | | | 100.0 | | | | | | | | | | | | |
| 7. |
North Carolina St. (35) |
11 - 9 |
20 - 14 |
11.0 - 9.0 |
20.0 - 14.0 |
| | | | | | 100.0 | | | | | | | | | | | |
| 8. |
Florida St. (63) |
11 - 9 |
18 - 15 |
11.0 - 9.0 |
18.0 - 15.0 |
| | | | | | | 100.0 | | | | | | | | | | |
| 9. |
California (76) |
9 - 10 |
21 - 12 |
9.0 - 10.0 |
21.0 - 12.0 |
| | | | | | | | 100.0 | | | | | | | | | |
| 10. |
Stanford (59) |
9 - 10 |
20 - 12 |
9.0 - 10.0 |
20.0 - 12.0 |
| | | | | | | | | 100.0 | | | | | | | | |
| 11. |
SMU (36) |
9 - 11 |
20 - 14 |
9.0 - 11.0 |
20.0 - 14.0 |
| | | | | | | | | | 100.0 | | | | | | | |
| 12. |
Virginia Tech (56) |
8 - 11 |
19 - 13 |
8.0 - 11.0 |
19.0 - 13.0 |
| | | | | | | | | | | 100.0 | | | | | | |
| 13. |
Wake Forest (65) |
8 - 12 |
18 - 17 |
8.0 - 12.0 |
18.0 - 17.0 |
| | | | | | | | | | | | 100.0 | | | | | |
| 14. |
Syracuse (83) |
6 - 13 |
15 - 17 |
6.0 - 13.0 |
15.0 - 17.0 |
| | | | | | | | | | | | | 100.0 | | | | |
| 15. |
Pittsburgh (98) |
6 - 14 |
13 - 20 |
6.0 - 14.0 |
13.0 - 20.0 |
| | | | | | | | | | | | | | 100.0 | | | |
| 16. |
Notre Dame (92) |
4 - 14 |
13 - 18 |
4.0 - 14.0 |
13.0 - 18.0 |
| | | | | | | | | | | | | | | 100.0 | | |
| 17. |
Boston College (148) |
4 - 14 |
11 - 20 |
4.0 - 14.0 |
11.0 - 20.0 |
| | | | | | | | | | | | | | | | 100.0 | |
| 18. |
Georgia Tech (161) |
2 - 16 |
11 - 20 |
2.0 - 16.0 |
11.0 - 20.0 |
| | | | | | | | | | | | | | | | | 100.0 |
Weekly Changes |
| 1. |
Duke (1) |
|
+0.0 | +0.0 | +0.0 | +0.0 | +0.0 | +0.0 | +0.0 | +0.0 | +0.0 | +0.0 | +0.0 | +0.0 | +0.0 | +0.0 | +0.0 | +0.0 | +0.0 | +0.0 |
| 2. |
Virginia (22) |
|
+0.0 | +0.0 | +0.0 | +0.0 | +0.0 | +0.0 | +0.0 | +0.0 | +0.0 | +0.0 | +0.0 | +0.0 | +0.0 | +0.0 | +0.0 | +0.0 | +0.0 | +0.0 |
| 3. |
Miami FL (31) |
|
+0.0 | +0.0 | +0.0 | +0.0 | +0.0 | +0.0 | +0.0 | +0.0 | +0.0 | +0.0 | +0.0 | +0.0 | +0.0 | +0.0 | +0.0 | +0.0 | +0.0 | +0.0 |
| 4. |
Clemson (39) |
|
+0.0 | +0.0 | +0.0 | +0.0 | +0.0 | +0.0 | +0.0 | +0.0 | +0.0 | +0.0 | +0.0 | +0.0 | +0.0 | +0.0 | +0.0 | +0.0 | +0.0 | +0.0 |
| 5. |
North Carolina (28) |
|
+0.0 | +0.0 | +0.0 | +0.0 | +0.0 | +0.0 | +0.0 | +0.0 | +0.0 | +0.0 | +0.0 | +0.0 | +0.0 | +0.0 | +0.0 | +0.0 | +0.0 | +0.0 |
| 6. |
Louisville (17) |
|
+0.0 | +0.0 | +0.0 | +0.0 | +0.0 | +0.0 | +0.0 | +0.0 | +0.0 | +0.0 | +0.0 | +0.0 | +0.0 | +0.0 | +0.0 | +0.0 | +0.0 | +0.0 |
| 7. |
North Carolina St. (35) |
|
+0.0 | +0.0 | +0.0 | +0.0 | +0.0 | +0.0 | +0.0 | +0.0 | +0.0 | +0.0 | +0.0 | +0.0 | +0.0 | +0.0 | +0.0 | +0.0 | +0.0 | +0.0 |
| 8. |
Florida St. (63) |
|
+0.0 | +0.0 | +0.0 | +0.0 | +0.0 | +0.0 | +0.0 | +0.0 | +0.0 | +0.0 | +0.0 | +0.0 | +0.0 | +0.0 | +0.0 | +0.0 | +0.0 | +0.0 |
| 9. |
California (76) |
|
+0.0 | +0.0 | +0.0 | +0.0 | +0.0 | +0.0 | +0.0 | +0.0 | +0.0 | +0.0 | +0.0 | +0.0 | +0.0 | +0.0 | +0.0 | +0.0 | +0.0 | +0.0 |
| 10. |
Stanford (59) |
|
+0.0 | +0.0 | +0.0 | +0.0 | +0.0 | +0.0 | +0.0 | +0.0 | +0.0 | +0.0 | +0.0 | +0.0 | +0.0 | +0.0 | +0.0 | +0.0 | +0.0 | +0.0 |
| 11. |
SMU (36) |
|
+0.0 | +0.0 | +0.0 | +0.0 | +0.0 | +0.0 | +0.0 | +0.0 | +0.0 | +0.0 | +0.0 | +0.0 | +0.0 | +0.0 | +0.0 | +0.0 | +0.0 | +0.0 |
| 12. |
Virginia Tech (56) |
|
+0.0 | +0.0 | +0.0 | +0.0 | +0.0 | +0.0 | +0.0 | +0.0 | +0.0 | +0.0 | +0.0 | +0.0 | +0.0 | +0.0 | +0.0 | +0.0 | +0.0 | +0.0 |
| 13. |
Wake Forest (65) |
|
+0.0 | +0.0 | +0.0 | +0.0 | +0.0 | +0.0 | +0.0 | +0.0 | +0.0 | +0.0 | +0.0 | +0.0 | +0.0 | +0.0 | +0.0 | +0.0 | +0.0 | +0.0 |
| 14. |
Syracuse (83) |
|
+0.0 | +0.0 | +0.0 | +0.0 | +0.0 | +0.0 | +0.0 | +0.0 | +0.0 | +0.0 | +0.0 | +0.0 | +0.0 | +0.0 | +0.0 | +0.0 | +0.0 | +0.0 |
| 15. |
Pittsburgh (98) |
|
+0.0 | +0.0 | +0.0 | +0.0 | +0.0 | +0.0 | +0.0 | +0.0 | +0.0 | +0.0 | +0.0 | +0.0 | +0.0 | +0.0 | +0.0 | +0.0 | +0.0 | +0.0 |
| 16. |
Notre Dame (92) |
|
+0.0 | +0.0 | +0.0 | +0.0 | +0.0 | +0.0 | +0.0 | +0.0 | +0.0 | +0.0 | +0.0 | +0.0 | +0.0 | +0.0 | +0.0 | +0.0 | +0.0 | +0.0 |
| 17. |
Boston College (148) |
|
+0.0 | +0.0 | +0.0 | +0.0 | +0.0 | +0.0 | +0.0 | +0.0 | +0.0 | +0.0 | +0.0 | +0.0 | +0.0 | +0.0 | +0.0 | +0.0 | +0.0 | +0.0 |
| 18. |
Georgia Tech (161) |
|
+0.0 | +0.0 | +0.0 | +0.0 | +0.0 | +0.0 | +0.0 | +0.0 | +0.0 | +0.0 | +0.0 | +0.0 | +0.0 | +0.0 | +0.0 | +0.0 | +0.0 | +0.0 |
This table gives the probability of earning at least a share of a given place.
So there are no tiebreakers and there can be multiple first place teams, for example.