America East
Updated with games through Friday, March 27
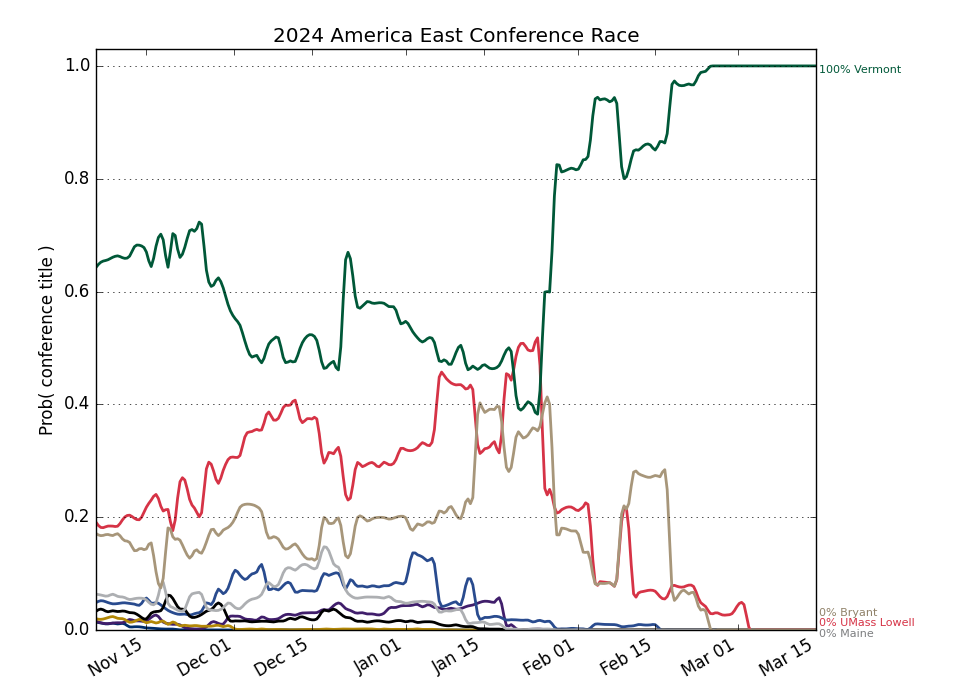
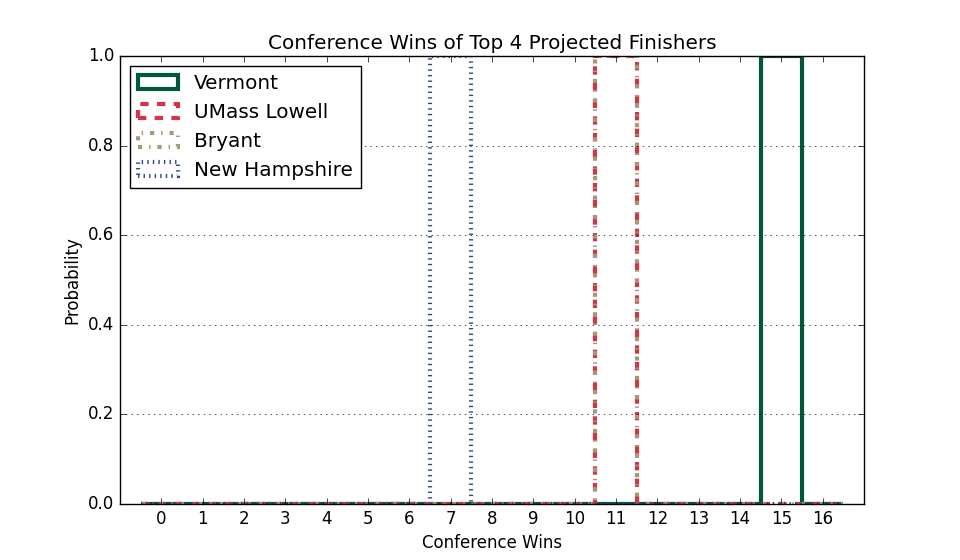
Conference Projections
Based on 10,000 simulations of the remaining season.
Tiebreaking was done using the
Big Ten tiebreaking procedures.
| America East |
Current Record |
Projected Record |
Projected Finish (% odds, with tiebreakers) |
|
Team |
Conf. |
Overall |
Conf. |
Overall |
1st | 2nd | 3rd | 4th | 5th | 6th | 7th | 8th | 9th |
| 1. |
UMBC (209) |
17 - 2 |
22 - 9 |
17.0 - 2.0 |
22.0 - 9.0 |
100.0 | | | | | | | | |
| 2. |
Vermont (244) |
14 - 5 |
20 - 12 |
14.0 - 5.0 |
20.0 - 12.0 |
| 100.0 | | | | | | | |
| 3. |
NJIT (331) |
11 - 7 |
15 - 17 |
11.0 - 7.0 |
15.0 - 17.0 |
| | 100.0 | | | | | | |
| 4. |
UMass Lowell (324) |
10 - 8 |
12 - 18 |
10.0 - 8.0 |
12.0 - 18.0 |
| | | 100.0 | | | | | |
| 5. |
Albany (329) |
7 - 10 |
8 - 21 |
7.0 - 10.0 |
8.0 - 21.0 |
| | | | 100.0 | | | | |
| 6. |
Maine (336) |
6 - 11 |
7 - 24 |
6.0 - 11.0 |
7.0 - 24.0 |
| | | | | 100.0 | | | |
| 7. |
Bryant (355) |
5 - 12 |
7 - 22 |
5.0 - 12.0 |
7.0 - 22.0 |
| | | | | | 100.0 | | |
| 8. |
New Hampshire (343) |
5 - 12 |
7 - 21 |
5.0 - 12.0 |
7.0 - 21.0 |
| | | | | | | 100.0 | |
| 9. |
Binghamton (361) |
4 - 12 |
5 - 23 |
4.0 - 12.0 |
5.0 - 23.0 |
| | | | | | | | 100.0 |
Weekly Changes |
| 1. |
UMBC (209) |
|
+0.0 | +0.0 | +0.0 | +0.0 | +0.0 | +0.0 | +0.0 | +0.0 | +0.0 |
| 2. |
Vermont (244) |
|
+0.0 | +0.0 | +0.0 | +0.0 | +0.0 | +0.0 | +0.0 | +0.0 | +0.0 |
| 3. |
NJIT (331) |
|
+0.0 | +0.0 | +0.0 | +0.0 | +0.0 | +0.0 | +0.0 | +0.0 | +0.0 |
| 4. |
UMass Lowell (324) |
|
+0.0 | +0.0 | +0.0 | +0.0 | +0.0 | +0.0 | +0.0 | +0.0 | +0.0 |
| 5. |
Albany (329) |
|
+0.0 | +0.0 | +0.0 | +0.0 | +0.0 | +0.0 | +0.0 | +0.0 | +0.0 |
| 6. |
Maine (336) |
|
+0.0 | +0.0 | +0.0 | +0.0 | +0.0 | +0.0 | +0.0 | +0.0 | +0.0 |
| 7. |
Bryant (355) |
|
+0.0 | +0.0 | +0.0 | +0.0 | +0.0 | +0.0 | +0.0 | +0.0 | +0.0 |
| 8. |
New Hampshire (343) |
|
+0.0 | +0.0 | +0.0 | +0.0 | +0.0 | +0.0 | +0.0 | +0.0 | +0.0 |
| 9. |
Binghamton (361) |
|
+0.0 | +0.0 | +0.0 | +0.0 | +0.0 | +0.0 | +0.0 | +0.0 | +0.0 |
This table gives the probability of earning at least a share of a given place.
So there are no tiebreakers and there can be multiple first place teams, for example.
This Week's Games
| Date |
Away |
W Prob, Pred Score |
Home |