American
Updated with games through Friday, March 27
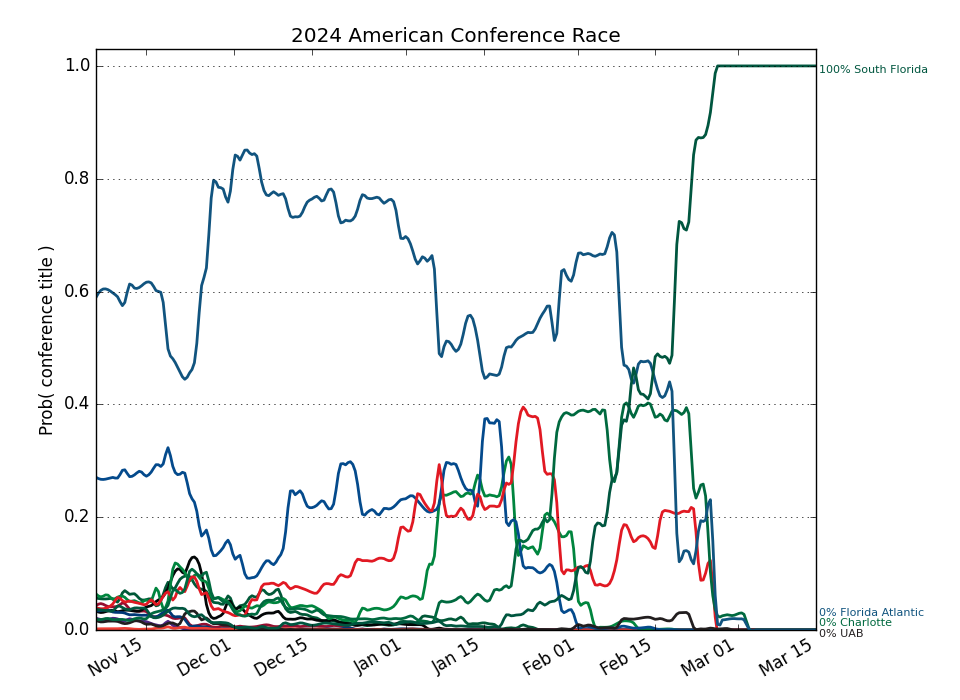
Conference Projections
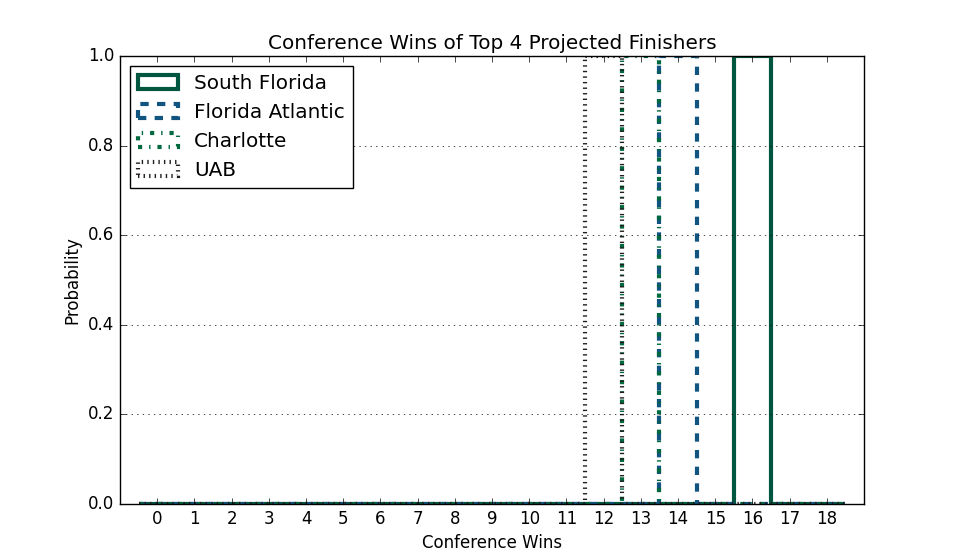
Based on 10,000 simulations of the remaining season.
Tiebreaking was done using the
Big Ten tiebreaking procedures.
| American |
Current Record |
Projected Record |
Projected Finish (% odds, with tiebreakers) |
|
Team |
Conf. |
Overall |
Conf. |
Overall |
1st | 2nd | 3rd | 4th | 5th | 6th | 7th | 8th | 9th | 10th | 11th | 12th | 13th |
| 1. |
South Florida (51) |
17 - 3 |
24 - 9 |
17.0 - 3.0 |
24.0 - 9.0 |
100.0 | | | | | | | | | | | | |
| 2. |
Tulsa (57) |
15 - 6 |
27 - 7 |
15.0 - 6.0 |
27.0 - 7.0 |
| 100.0 | | | | | | | | | | | |
| 3. |
Wichita St. (75) |
14 - 7 |
23 - 12 |
14.0 - 7.0 |
23.0 - 12.0 |
| | 100.0 | | | | | | | | | | |
| 4. |
UAB (123) |
11 - 8 |
19 - 12 |
11.0 - 8.0 |
19.0 - 12.0 |
| | | 100.0 | | | | | | | | | |
| 5. |
Charlotte (182) |
11 - 10 |
16 - 17 |
11.0 - 10.0 |
16.0 - 17.0 |
| | | | 100.0 | | | | | | | | |
| 6. |
North Texas (144) |
10 - 10 |
17 - 14 |
10.0 - 10.0 |
17.0 - 14.0 |
| | | | | 100.0 | | | | | | | |
| 7. |
Florida Atlantic (127) |
10 - 10 |
16 - 15 |
10.0 - 10.0 |
16.0 - 15.0 |
| | | | | | 100.0 | | | | | | |
| 8. |
Tulane (219) |
9 - 11 |
17 - 15 |
9.0 - 11.0 |
17.0 - 15.0 |
| | | | | | | 100.0 | | | | | |
| 9. |
Memphis (137) |
8 - 11 |
13 - 19 |
8.0 - 11.0 |
13.0 - 19.0 |
| | | | | | | | 100.0 | | | | |
| 10. |
Temple (166) |
8 - 11 |
15 - 16 |
8.0 - 11.0 |
15.0 - 16.0 |
| | | | | | | | | 100.0 | | | |
| 11. |
Rice (247) |
7 - 11 |
11 - 18 |
7.0 - 11.0 |
11.0 - 18.0 |
| | | | | | | | | | 100.0 | | |
| 12. |
East Carolina (265) |
6 - 12 |
10 - 20 |
6.0 - 12.0 |
10.0 - 20.0 |
| | | | | | | | | | | 100.0 | |
| 13. |
UTSA (344) |
1 - 17 |
3 - 25 |
1.0 - 17.0 |
3.0 - 25.0 |
| | | | | | | | | | | | 100.0 |
Weekly Changes |
| 1. |
South Florida (51) |
|
+0.0 | +0.0 | +0.0 | +0.0 | +0.0 | +0.0 | +0.0 | +0.0 | +0.0 | +0.0 | +0.0 | +0.0 | +0.0 |
| 2. |
Tulsa (57) |
|
+0.0 | +100.0 | -100.0 | +0.0 | +0.0 | +0.0 | +0.0 | +0.0 | +0.0 | +0.0 | +0.0 | +0.0 | +0.0 |
| 3. |
Wichita St. (75) |
|
+0.0 | -100.0 | +100.0 | +0.0 | +0.0 | +0.0 | +0.0 | +0.0 | +0.0 | +0.0 | +0.0 | +0.0 | +0.0 |
| 4. |
UAB (123) |
|
+0.0 | +0.0 | +0.0 | +0.0 | +0.0 | +0.0 | +0.0 | +0.0 | +0.0 | +0.0 | +0.0 | +0.0 | +0.0 |
| 5. |
Charlotte (182) |
|
+0.0 | +0.0 | +0.0 | +0.0 | +0.0 | +0.0 | +0.0 | +0.0 | +0.0 | +0.0 | +0.0 | +0.0 | +0.0 |
| 6. |
North Texas (144) |
|
+0.0 | +0.0 | +0.0 | +0.0 | +0.0 | +0.0 | +0.0 | +0.0 | +0.0 | +0.0 | +0.0 | +0.0 | +0.0 |
| 7. |
Florida Atlantic (127) |
|
+0.0 | +0.0 | +0.0 | +0.0 | +0.0 | +0.0 | +0.0 | +0.0 | +0.0 | +0.0 | +0.0 | +0.0 | +0.0 |
| 8. |
Tulane (219) |
|
+0.0 | +0.0 | +0.0 | +0.0 | +0.0 | +0.0 | +0.0 | +0.0 | +0.0 | +0.0 | +0.0 | +0.0 | +0.0 |
| 9. |
Memphis (137) |
|
+0.0 | +0.0 | +0.0 | +0.0 | +0.0 | +0.0 | +0.0 | +0.0 | +0.0 | +0.0 | +0.0 | +0.0 | +0.0 |
| 10. |
Temple (166) |
|
+0.0 | +0.0 | +0.0 | +0.0 | +0.0 | +0.0 | +0.0 | +0.0 | +0.0 | +0.0 | +0.0 | +0.0 | +0.0 |
| 11. |
Rice (247) |
|
+0.0 | +0.0 | +0.0 | +0.0 | +0.0 | +0.0 | +0.0 | +0.0 | +0.0 | +0.0 | +0.0 | +0.0 | +0.0 |
| 12. |
East Carolina (265) |
|
+0.0 | +0.0 | +0.0 | +0.0 | +0.0 | +0.0 | +0.0 | +0.0 | +0.0 | +0.0 | +0.0 | +0.0 | +0.0 |
| 13. |
UTSA (344) |
|
+0.0 | +0.0 | +0.0 | +0.0 | +0.0 | +0.0 | +0.0 | +0.0 | +0.0 | +0.0 | +0.0 | +0.0 | +0.0 |
This table gives the probability of earning at least a share of a given place.
So there are no tiebreakers and there can be multiple first place teams, for example.
This Week's Games
| Date |
Away |
W Prob, Pred Score |
Home |
| Apr. 02 |
New Mexico |
59.3% |
83 |
80 |
40.7% |
Tulsa |