Big Ten
Updated with games through Friday, March 27
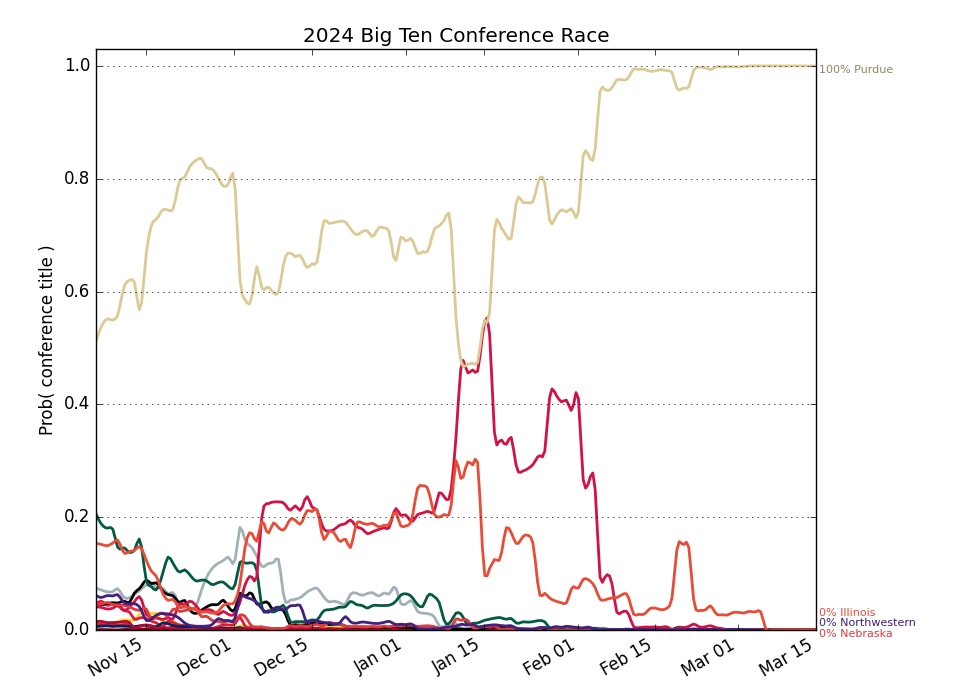
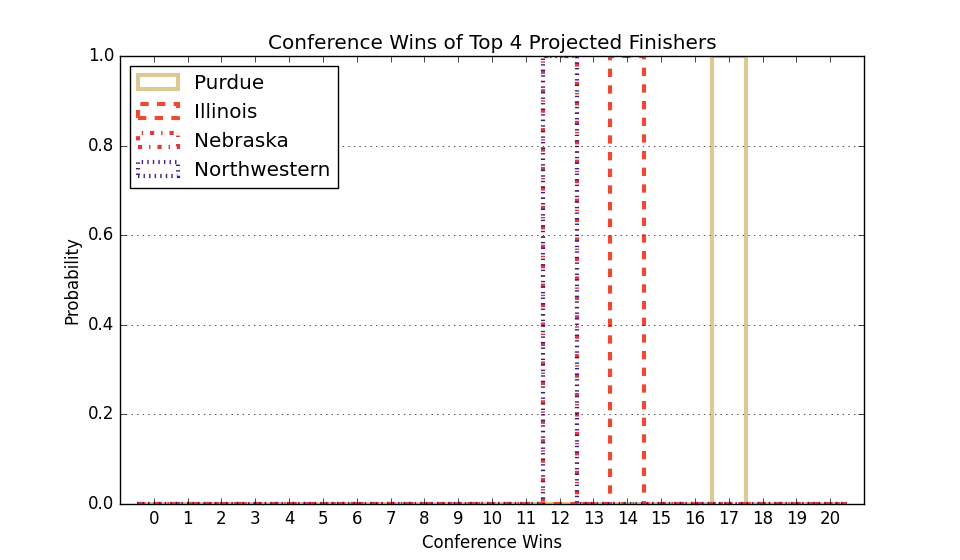
Conference Projections
Based on 10,000 simulations of the remaining season.
Tiebreaking was done using the
Big Ten tiebreaking procedures.
| Big Ten |
Current Record |
Projected Record |
Projected Finish (% odds, with tiebreakers) |
|
Team |
Conf. |
Overall |
Conf. |
Overall |
1st | 2nd | 3rd | 4th | 5th | 6th | 7th | 8th | 9th | 10th | 11th | 12th | 13th | 14th | 15th | 16th | 17th | 18th |
| 1. |
Michigan (2) |
21 - 2 |
34 - 3 |
21.0 - 2.0 |
34.0 - 3.0 |
100.0 | | | | | | | | | | | | | | | | | |
| 2. |
Michigan St. (10) |
15 - 6 |
27 - 8 |
15.0 - 6.0 |
27.0 - 8.0 |
| 100.0 | | | | | | | | | | | | | | | | |
| 3. |
Illinois (4) |
15 - 6 |
27 - 8 |
15.0 - 6.0 |
27.0 - 8.0 |
| | 100.0 | | | | | | | | | | | | | | | |
| 4. |
Purdue (6) |
17 - 7 |
30 - 8 |
17.0 - 7.0 |
30.0 - 8.0 |
| | | 100.0 | | | | | | | | | | | | | | |
| 5. |
Wisconsin (27) |
16 - 7 |
24 - 11 |
16.0 - 7.0 |
24.0 - 11.0 |
| | | | 100.0 | | | | | | | | | | | | | |
| 6. |
Nebraska (16) |
15 - 7 |
28 - 7 |
15.0 - 7.0 |
28.0 - 7.0 |
| | | | | 100.0 | | | | | | | | | | | | |
| 7. |
UCLA (30) |
15 - 8 |
24 - 12 |
15.0 - 8.0 |
24.0 - 12.0 |
| | | | | | 100.0 | | | | | | | | | | | |
| 8. |
Ohio St. (25) |
13 - 9 |
21 - 13 |
13.0 - 9.0 |
21.0 - 13.0 |
| | | | | | | 100.0 | | | | | | | | | | |
| 9. |
Iowa (20) |
12 - 11 |
24 - 12 |
12.0 - 11.0 |
24.0 - 12.0 |
| | | | | | | | 100.0 | | | | | | | | | |
| 10. |
Indiana (37) |
9 - 12 |
18 - 14 |
9.0 - 12.0 |
18.0 - 14.0 |
| | | | | | | | | 100.0 | | | | | | | | |
| 11. |
Minnesota (66) |
8 - 13 |
15 - 17 |
8.0 - 13.0 |
15.0 - 17.0 |
| | | | | | | | | | 100.0 | | | | | | | |
| 12. |
Washington (48) |
8 - 14 |
16 - 17 |
8.0 - 14.0 |
16.0 - 17.0 |
| | | | | | | | | | | 100.0 | | | | | | |
| 13. |
USC (77) |
7 - 14 |
17 - 14 |
7.0 - 14.0 |
17.0 - 14.0 |
| | | | | | | | | | | | 100.0 | | | | | |
| 14. |
Rutgers (132) |
7 - 15 |
14 - 19 |
7.0 - 15.0 |
14.0 - 19.0 |
| | | | | | | | | | | | | 100.0 | | | | |
| 15. |
Northwestern (52) |
7 - 16 |
15 - 19 |
7.0 - 16.0 |
15.0 - 19.0 |
| | | | | | | | | | | | | | 100.0 | | | |
| 16. |
Oregon (95) |
5 - 16 |
12 - 20 |
5.0 - 16.0 |
12.0 - 20.0 |
| | | | | | | | | | | | | | | 100.0 | | |
| 17. |
Maryland (126) |
5 - 17 |
12 - 21 |
5.0 - 17.0 |
12.0 - 21.0 |
| | | | | | | | | | | | | | | | 100.0 | |
| 18. |
Penn St. (130) |
3 - 18 |
12 - 20 |
3.0 - 18.0 |
12.0 - 20.0 |
| | | | | | | | | | | | | | | | | 100.0 |
Weekly Changes |
| 1. |
Michigan (2) |
|
+0.0 | +0.0 | +0.0 | +0.0 | +0.0 | +0.0 | +0.0 | +0.0 | +0.0 | +0.0 | +0.0 | +0.0 | +0.0 | +0.0 | +0.0 | +0.0 | +0.0 | +0.0 |
| 2. |
Michigan St. (10) |
|
+0.0 | +100.0 | -100.0 | +0.0 | +0.0 | +0.0 | +0.0 | +0.0 | +0.0 | +0.0 | +0.0 | +0.0 | +0.0 | +0.0 | +0.0 | +0.0 | +0.0 | +0.0 |
| 3. |
Illinois (4) |
|
+0.0 | +0.0 | +100.0 | -100.0 | +0.0 | +0.0 | +0.0 | +0.0 | +0.0 | +0.0 | +0.0 | +0.0 | +0.0 | +0.0 | +0.0 | +0.0 | +0.0 | +0.0 |
| 4. |
Purdue (6) |
|
+0.0 | +0.0 | +0.0 | +100.0 | -100.0 | +0.0 | +0.0 | +0.0 | +0.0 | +0.0 | +0.0 | +0.0 | +0.0 | +0.0 | +0.0 | +0.0 | +0.0 | +0.0 |
| 5. |
Wisconsin (27) |
|
+0.0 | +0.0 | +0.0 | +0.0 | +100.0 | -100.0 | +0.0 | +0.0 | +0.0 | +0.0 | +0.0 | +0.0 | +0.0 | +0.0 | +0.0 | +0.0 | +0.0 | +0.0 |
| 6. |
Nebraska (16) |
|
+0.0 | -100.0 | +0.0 | +0.0 | +0.0 | +100.0 | +0.0 | +0.0 | +0.0 | +0.0 | +0.0 | +0.0 | +0.0 | +0.0 | +0.0 | +0.0 | +0.0 | +0.0 |
| 7. |
UCLA (30) |
|
+0.0 | +0.0 | +0.0 | +0.0 | +0.0 | +0.0 | +0.0 | +0.0 | +0.0 | +0.0 | +0.0 | +0.0 | +0.0 | +0.0 | +0.0 | +0.0 | +0.0 | +0.0 |
| 8. |
Ohio St. (25) |
|
+0.0 | +0.0 | +0.0 | +0.0 | +0.0 | +0.0 | +0.0 | +0.0 | +0.0 | +0.0 | +0.0 | +0.0 | +0.0 | +0.0 | +0.0 | +0.0 | +0.0 | +0.0 |
| 9. |
Iowa (20) |
|
+0.0 | +0.0 | +0.0 | +0.0 | +0.0 | +0.0 | +0.0 | +0.0 | +0.0 | +0.0 | +0.0 | +0.0 | +0.0 | +0.0 | +0.0 | +0.0 | +0.0 | +0.0 |
| 10. |
Indiana (37) |
|
+0.0 | +0.0 | +0.0 | +0.0 | +0.0 | +0.0 | +0.0 | +0.0 | +0.0 | +0.0 | +0.0 | +0.0 | +0.0 | +0.0 | +0.0 | +0.0 | +0.0 | +0.0 |
| 11. |
Minnesota (66) |
|
+0.0 | +0.0 | +0.0 | +0.0 | +0.0 | +0.0 | +0.0 | +0.0 | +0.0 | +0.0 | +0.0 | +0.0 | +0.0 | +0.0 | +0.0 | +0.0 | +0.0 | +0.0 |
| 12. |
Washington (48) |
|
+0.0 | +0.0 | +0.0 | +0.0 | +0.0 | +0.0 | +0.0 | +0.0 | +0.0 | +0.0 | +0.0 | +0.0 | +0.0 | +0.0 | +0.0 | +0.0 | +0.0 | +0.0 |
| 13. |
USC (77) |
|
+0.0 | +0.0 | +0.0 | +0.0 | +0.0 | +0.0 | +0.0 | +0.0 | +0.0 | +0.0 | +0.0 | +0.0 | +0.0 | +0.0 | +0.0 | +0.0 | +0.0 | +0.0 |
| 14. |
Rutgers (132) |
|
+0.0 | +0.0 | +0.0 | +0.0 | +0.0 | +0.0 | +0.0 | +0.0 | +0.0 | +0.0 | +0.0 | +0.0 | +0.0 | +0.0 | +0.0 | +0.0 | +0.0 | +0.0 |
| 15. |
Northwestern (52) |
|
+0.0 | +0.0 | +0.0 | +0.0 | +0.0 | +0.0 | +0.0 | +0.0 | +0.0 | +0.0 | +0.0 | +0.0 | +0.0 | +0.0 | +0.0 | +0.0 | +0.0 | +0.0 |
| 16. |
Oregon (95) |
|
+0.0 | +0.0 | +0.0 | +0.0 | +0.0 | +0.0 | +0.0 | +0.0 | +0.0 | +0.0 | +0.0 | +0.0 | +0.0 | +0.0 | +0.0 | +0.0 | +0.0 | +0.0 |
| 17. |
Maryland (126) |
|
+0.0 | +0.0 | +0.0 | +0.0 | +0.0 | +0.0 | +0.0 | +0.0 | +0.0 | +0.0 | +0.0 | +0.0 | +0.0 | +0.0 | +0.0 | +0.0 | +0.0 | +0.0 |
| 18. |
Penn St. (130) |
|
+0.0 | +0.0 | +0.0 | +0.0 | +0.0 | +0.0 | +0.0 | +0.0 | +0.0 | +0.0 | +0.0 | +0.0 | +0.0 | +0.0 | +0.0 | +0.0 | +0.0 | +0.0 |
This table gives the probability of earning at least a share of a given place.
So there are no tiebreakers and there can be multiple first place teams, for example.