Big 12
Updated with games through Friday, March 27
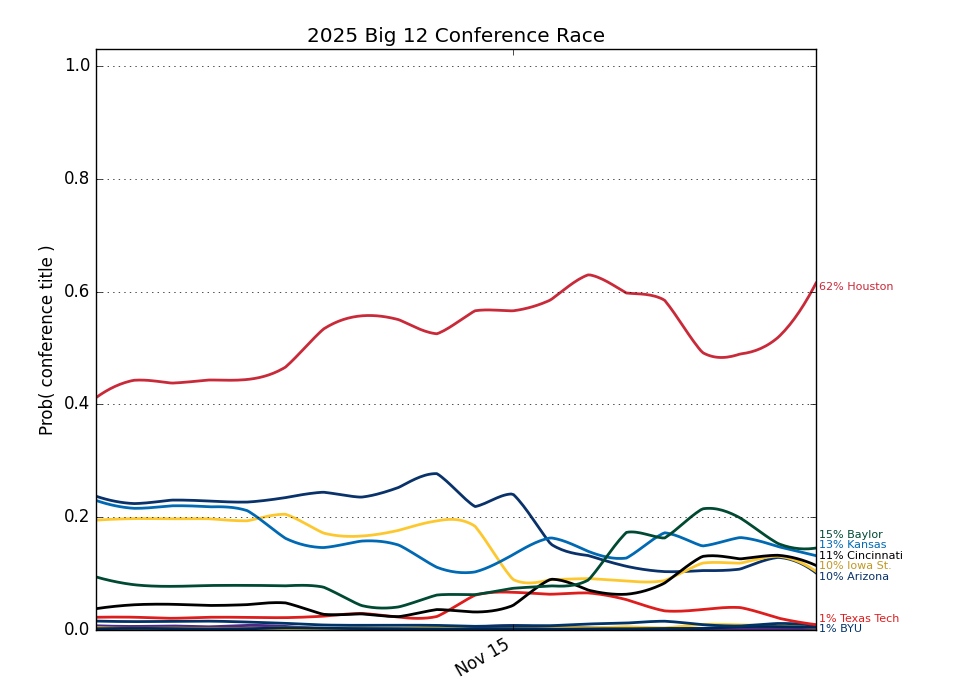
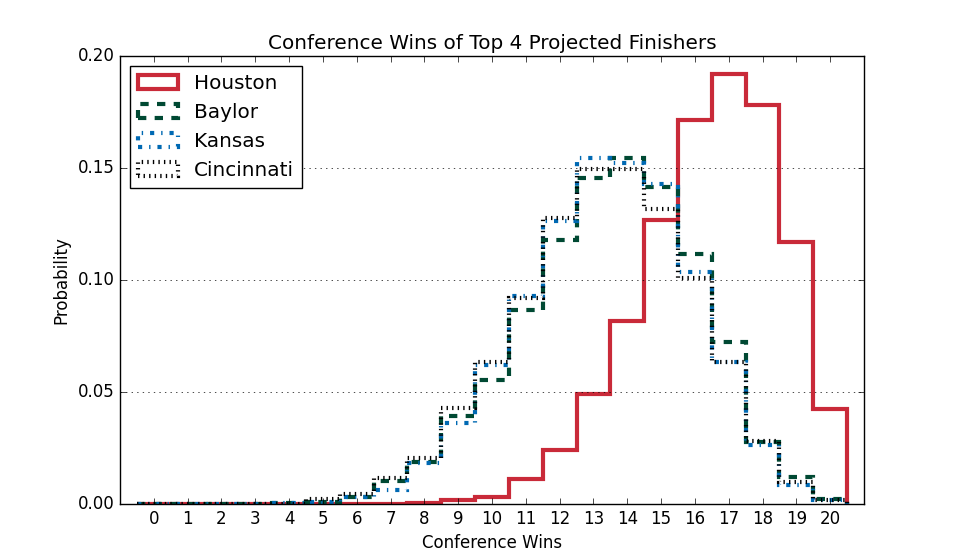
Conference Projections
Based on 10,000 simulations of the remaining season.
Tiebreaking was done using the
Big Ten tiebreaking procedures.
| Big 12 |
Current Record |
Projected Record |
Projected Finish (% odds, with tiebreakers) |
|
Team |
Conf. |
Overall |
Conf. |
Overall |
1st | 2nd | 3rd | 4th | 5th | 6th | 7th | 8th | 9th | 10th | 11th | 12th | 13th | 14th | 15th | 16th |
| 1. |
Arizona (3) |
19 - 2 |
35 - 2 |
19.0 - 2.0 |
35.0 - 2.0 |
100.0 | | | | | | | | | | | | | | | |
| 2. |
Houston (8) |
16 - 5 |
30 - 7 |
16.0 - 5.0 |
30.0 - 7.0 |
| 100.0 | | | | | | | | | | | | | | |
| 3. |
Iowa St. (7) |
14 - 7 |
29 - 8 |
14.0 - 7.0 |
29.0 - 8.0 |
| | 100.0 | | | | | | | | | | | | | |
| 4. |
Kansas (23) |
13 - 7 |
24 - 11 |
13.0 - 7.0 |
24.0 - 11.0 |
| | | 100.0 | | | | | | | | | | | | |
| 5. |
Texas Tech (19) |
12 - 7 |
23 - 11 |
12.0 - 7.0 |
23.0 - 11.0 |
| | | | 100.0 | | | | | | | | | | | |
| 6. |
TCU (43) |
12 - 8 |
23 - 12 |
12.0 - 8.0 |
23.0 - 12.0 |
| | | | | 100.0 | | | | | | | | | | |
| 7. |
BYU (21) |
11 - 10 |
23 - 12 |
11.0 - 10.0 |
23.0 - 12.0 |
| | | | | | 100.0 | | | | | | | | | |
| 8. |
UCF (54) |
10 - 10 |
21 - 12 |
10.0 - 10.0 |
21.0 - 12.0 |
| | | | | | | 100.0 | | | | | | | | |
| 9. |
Cincinnati (47) |
10 - 10 |
18 - 15 |
10.0 - 10.0 |
18.0 - 15.0 |
| | | | | | | | 100.0 | | | | | | | |
| 10. |
West Virginia (62) |
9 - 10 |
18 - 14 |
9.0 - 10.0 |
18.0 - 14.0 |
| | | | | | | | | 100.0 | | | | | | |
| 11. |
Arizona St. (74) |
8 - 12 |
17 - 16 |
8.0 - 12.0 |
17.0 - 16.0 |
| | | | | | | | | | 100.0 | | | | | |
| 12. |
Colorado (68) |
7 - 12 |
17 - 15 |
7.0 - 12.0 |
17.0 - 15.0 |
| | | | | | | | | | | 100.0 | | | | |
| 13. |
Oklahoma St. (81) |
7 - 13 |
20 - 15 |
7.0 - 13.0 |
20.0 - 15.0 |
| | | | | | | | | | | | 100.0 | | | |
| 14. |
Baylor (41) |
6 - 13 |
15 - 16 |
6.0 - 13.0 |
15.0 - 16.0 |
| | | | | | | | | | | | | 100.0 | | |
| 15. |
Kansas St. (99) |
3 - 16 |
12 - 20 |
3.0 - 16.0 |
12.0 - 20.0 |
| | | | | | | | | | | | | | 100.0 | |
| 16. |
Utah (117) |
2 - 17 |
10 - 22 |
2.0 - 17.0 |
10.0 - 22.0 |
| | | | | | | | | | | | | | | 100.0 |
Weekly Changes |
| 1. |
Arizona (3) |
|
+0.0 | +0.0 | +0.0 | +0.0 | +0.0 | +0.0 | +0.0 | +0.0 | +0.0 | +0.0 | +0.0 | +0.0 | +0.0 | +0.0 | +0.0 | +0.0 |
| 2. |
Houston (8) |
|
+0.0 | +0.0 | +0.0 | +0.0 | +0.0 | +0.0 | +0.0 | +0.0 | +0.0 | +0.0 | +0.0 | +0.0 | +0.0 | +0.0 | +0.0 | +0.0 |
| 3. |
Iowa St. (7) |
|
+0.0 | +0.0 | +0.0 | +0.0 | +0.0 | +0.0 | +0.0 | +0.0 | +0.0 | +0.0 | +0.0 | +0.0 | +0.0 | +0.0 | +0.0 | +0.0 |
| 4. |
Kansas (23) |
|
+0.0 | +0.0 | +0.0 | +0.0 | +0.0 | +0.0 | +0.0 | +0.0 | +0.0 | +0.0 | +0.0 | +0.0 | +0.0 | +0.0 | +0.0 | +0.0 |
| 5. |
Texas Tech (19) |
|
+0.0 | +0.0 | +0.0 | +0.0 | +0.0 | +0.0 | +0.0 | +0.0 | +0.0 | +0.0 | +0.0 | +0.0 | +0.0 | +0.0 | +0.0 | +0.0 |
| 6. |
TCU (43) |
|
+0.0 | +0.0 | +0.0 | +0.0 | +0.0 | +0.0 | +0.0 | +0.0 | +0.0 | +0.0 | +0.0 | +0.0 | +0.0 | +0.0 | +0.0 | +0.0 |
| 7. |
BYU (21) |
|
+0.0 | +0.0 | +0.0 | +0.0 | +0.0 | +0.0 | +0.0 | +0.0 | +0.0 | +0.0 | +0.0 | +0.0 | +0.0 | +0.0 | +0.0 | +0.0 |
| 8. |
UCF (54) |
|
+0.0 | +0.0 | +0.0 | +0.0 | +0.0 | +0.0 | +0.0 | +0.0 | +0.0 | +0.0 | +0.0 | +0.0 | +0.0 | +0.0 | +0.0 | +0.0 |
| 9. |
Cincinnati (47) |
|
+0.0 | +0.0 | +0.0 | +0.0 | +0.0 | +0.0 | +0.0 | +0.0 | +0.0 | +0.0 | +0.0 | +0.0 | +0.0 | +0.0 | +0.0 | +0.0 |
| 10. |
West Virginia (62) |
|
+0.0 | +0.0 | +0.0 | +0.0 | +0.0 | +0.0 | +0.0 | +0.0 | +0.0 | +0.0 | +0.0 | +0.0 | +0.0 | +0.0 | +0.0 | +0.0 |
| 11. |
Arizona St. (74) |
|
+0.0 | +0.0 | +0.0 | +0.0 | +0.0 | +0.0 | +0.0 | +0.0 | +0.0 | +0.0 | +0.0 | +0.0 | +0.0 | +0.0 | +0.0 | +0.0 |
| 12. |
Colorado (68) |
|
+0.0 | +0.0 | +0.0 | +0.0 | +0.0 | +0.0 | +0.0 | +0.0 | +0.0 | +0.0 | +0.0 | +0.0 | +0.0 | +0.0 | +0.0 | +0.0 |
| 13. |
Oklahoma St. (81) |
|
+0.0 | +0.0 | +0.0 | +0.0 | +0.0 | +0.0 | +0.0 | +0.0 | +0.0 | +0.0 | +0.0 | +0.0 | +0.0 | +0.0 | +0.0 | +0.0 |
| 14. |
Baylor (41) |
|
+0.0 | +0.0 | +0.0 | +0.0 | +0.0 | +0.0 | +0.0 | +0.0 | +0.0 | +0.0 | +0.0 | +0.0 | +0.0 | +0.0 | +0.0 | +0.0 |
| 15. |
Kansas St. (99) |
|
+0.0 | +0.0 | +0.0 | +0.0 | +0.0 | +0.0 | +0.0 | +0.0 | +0.0 | +0.0 | +0.0 | +0.0 | +0.0 | +0.0 | +0.0 | +0.0 |
| 16. |
Utah (117) |
|
+0.0 | +0.0 | +0.0 | +0.0 | +0.0 | +0.0 | +0.0 | +0.0 | +0.0 | +0.0 | +0.0 | +0.0 | +0.0 | +0.0 | +0.0 | +0.0 |
This table gives the probability of earning at least a share of a given place.
So there are no tiebreakers and there can be multiple first place teams, for example.