| Colonial |
Current Record |
Projected Record |
Projected Finish (% odds, with tiebreakers) |
|
Team |
Conf. |
Overall |
Conf. |
Overall |
1st | 2nd | 3rd | 4th | 5th | 6th | 7th | 8th | 9th | 10th | 11th | 12th | 13th |
| 1. |
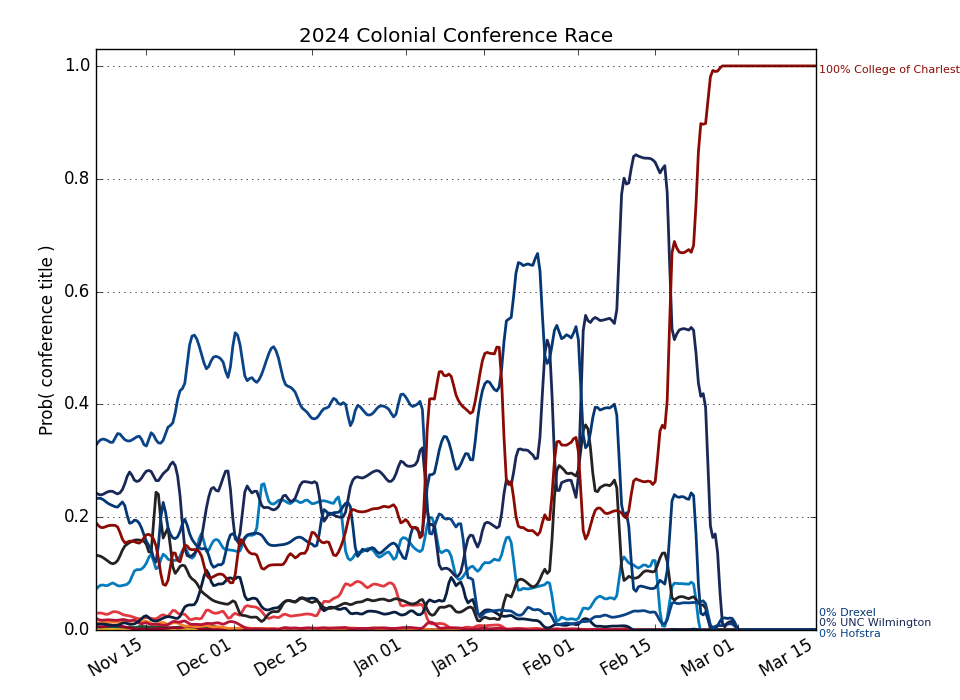
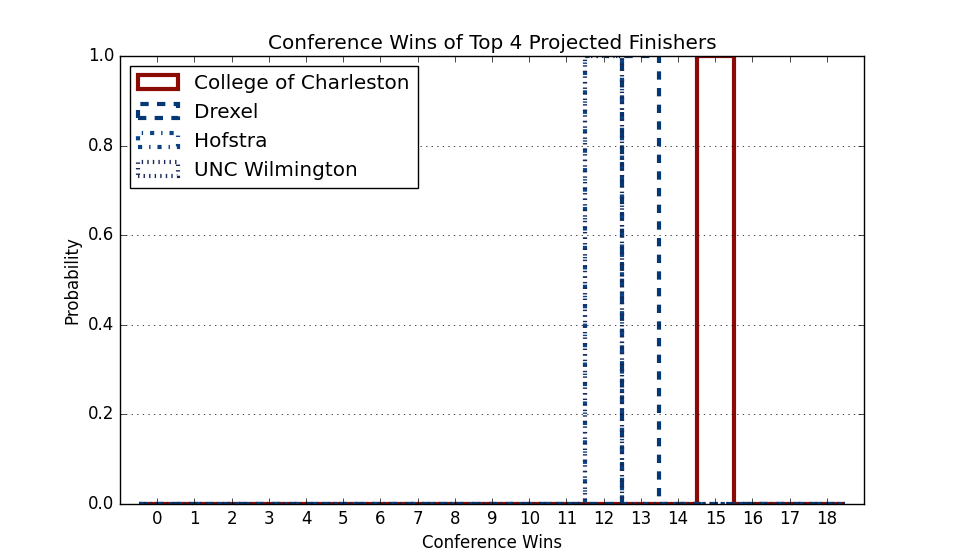
UNC Wilmington (107) |
16 - 3 |
26 - 6 |
16.0 - 3.0 |
26.0 - 6.0 |
100.0 | | | | | | | | | | | | |
| 2. |
College of Charleston (169) |
14 - 5 |
20 - 11 |
14.0 - 5.0 |
20.0 - 11.0 |
| 100.0 | | | | | | | | | | | |
| 3. |
Hofstra (93) |
15 - 6 |
22 - 11 |
15.0 - 6.0 |
22.0 - 11.0 |
| | 100.0 | | | | | | | | | | |
| 4. |
Monmouth (164) |
13 - 8 |
18 - 15 |
13.0 - 8.0 |
18.0 - 15.0 |
| | | 100.0 | | | | | | | | | |
| 5. |
Drexel (217) |
11 - 9 |
16 - 16 |
11.0 - 9.0 |
16.0 - 16.0 |
| | | | 100.0 | | | | | | | | |
| 6. |
William & Mary (134) |
11 - 9 |
18 - 12 |
11.0 - 9.0 |
18.0 - 12.0 |
| | | | | 100.0 | | | | | | | |
| 7. |
Towson (155) |
11 - 10 |
17 - 15 |
11.0 - 10.0 |
17.0 - 15.0 |
| | | | | | 100.0 | | | | | | |
| 8. |
Stony Brook (241) |
9 - 10 |
15 - 15 |
9.0 - 10.0 |
15.0 - 15.0 |
| | | | | | | 100.0 | | | | | |
| 9. |
Campbell (203) |
9 - 12 |
13 - 19 |
9.0 - 12.0 |
13.0 - 19.0 |
| | | | | | | | 100.0 | | | | |
| 10. |
Hampton (268) |
7 - 12 |
11 - 19 |
7.0 - 12.0 |
11.0 - 19.0 |
| | | | | | | | | 100.0 | | | |
| 11. |
Elon (224) |
6 - 13 |
12 - 18 |
6.0 - 13.0 |
12.0 - 18.0 |
| | | | | | | | | | 100.0 | | |
| 12. |
North Carolina A&T (272) |
4 - 15 |
9 - 19 |
4.0 - 15.0 |
9.0 - 19.0 |
| | | | | | | | | | | 100.0 | |
| 13. |
Northeastern (280) |
3 - 17 |
7 - 24 |
3.0 - 17.0 |
7.0 - 24.0 |
| | | | | | | | | | | | 100.0 |
Weekly Changes |
| 1. |
UNC Wilmington (107) |
|
+0.0 | +0.0 | +0.0 | +0.0 | +0.0 | +0.0 | +0.0 | +0.0 | +0.0 | +0.0 | +0.0 | +0.0 | +0.0 |
| 2. |
College of Charleston (169) |
|
+0.0 | +0.0 | +0.0 | +0.0 | +0.0 | +0.0 | +0.0 | +0.0 | +0.0 | +0.0 | +0.0 | +0.0 | +0.0 |
| 3. |
Hofstra (93) |
|
+0.0 | +0.0 | +0.0 | +0.0 | +0.0 | +0.0 | +0.0 | +0.0 | +0.0 | +0.0 | +0.0 | +0.0 | +0.0 |
| 4. |
Monmouth (164) |
|
+0.0 | +0.0 | +0.0 | +0.0 | +0.0 | +0.0 | +0.0 | +0.0 | +0.0 | +0.0 | +0.0 | +0.0 | +0.0 |
| 5. |
Drexel (217) |
|
+0.0 | +0.0 | +0.0 | +0.0 | +0.0 | +0.0 | +0.0 | +0.0 | +0.0 | +0.0 | +0.0 | +0.0 | +0.0 |
| 6. |
William & Mary (134) |
|
+0.0 | +0.0 | +0.0 | +0.0 | +0.0 | +0.0 | +0.0 | +0.0 | +0.0 | +0.0 | +0.0 | +0.0 | +0.0 |
| 7. |
Towson (155) |
|
+0.0 | +0.0 | +0.0 | +0.0 | +0.0 | +0.0 | +0.0 | +0.0 | +0.0 | +0.0 | +0.0 | +0.0 | +0.0 |
| 8. |
Stony Brook (241) |
|
+0.0 | +0.0 | +0.0 | +0.0 | +0.0 | +0.0 | +0.0 | +0.0 | +0.0 | +0.0 | +0.0 | +0.0 | +0.0 |
| 9. |
Campbell (203) |
|
+0.0 | +0.0 | +0.0 | +0.0 | +0.0 | +0.0 | +0.0 | +0.0 | +0.0 | +0.0 | +0.0 | +0.0 | +0.0 |
| 10. |
Hampton (268) |
|
+0.0 | +0.0 | +0.0 | +0.0 | +0.0 | +0.0 | +0.0 | +0.0 | +0.0 | +0.0 | +0.0 | +0.0 | +0.0 |
| 11. |
Elon (224) |
|
+0.0 | +0.0 | +0.0 | +0.0 | +0.0 | +0.0 | +0.0 | +0.0 | +0.0 | +0.0 | +0.0 | +0.0 | +0.0 |
| 12. |
North Carolina A&T (272) |
|
+0.0 | +0.0 | +0.0 | +0.0 | +0.0 | +0.0 | +0.0 | +0.0 | +0.0 | +0.0 | +0.0 | +0.0 | +0.0 |
| 13. |
Northeastern (280) |
|
+0.0 | +0.0 | +0.0 | +0.0 | +0.0 | +0.0 | +0.0 | +0.0 | +0.0 | +0.0 | +0.0 | +0.0 | +0.0 |