Conference USA
Updated with games through Friday, March 27
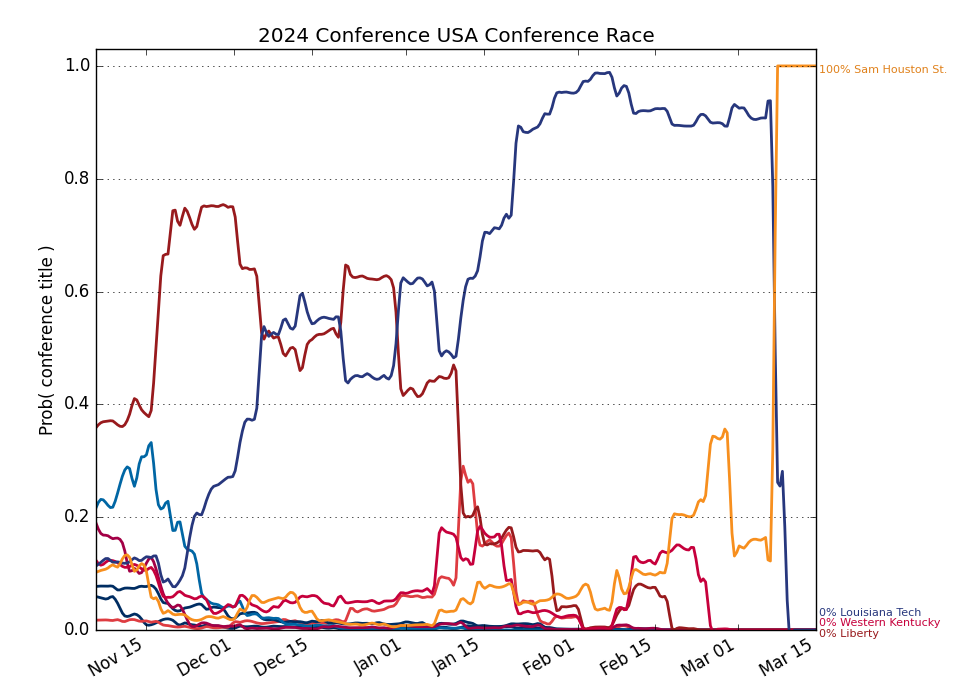
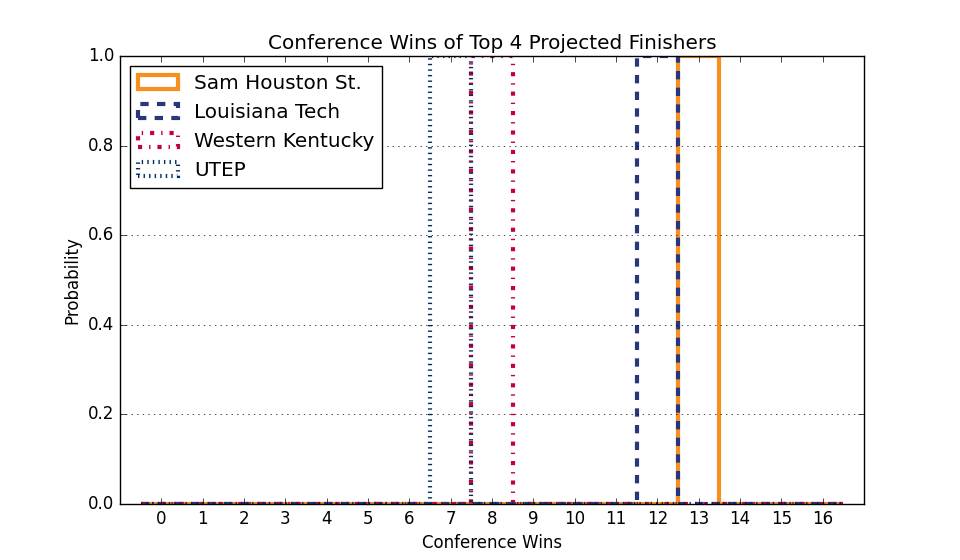
Conference Projections
Based on 10,000 simulations of the remaining season.
Tiebreaking was done using the
Big Ten tiebreaking procedures.
| Conference USA |
Current Record |
Projected Record |
Projected Finish (% odds, with tiebreakers) |
|
Team |
Conf. |
Overall |
Conf. |
Overall |
1st | 2nd | 3rd | 4th | 5th | 6th | 7th | 8th | 9th | 10th | 11th | 12th |
| 1. |
Liberty (121) |
17 - 4 |
23 - 8 |
17.0 - 4.0 |
23.0 - 8.0 |
100.0 | | | | | | | | | | | |
| 2. |
Sam Houston St. (116) |
14 - 8 |
19 - 12 |
14.0 - 8.0 |
19.0 - 12.0 |
| 100.0 | | | | | | | | | | |
| 3. |
Kennesaw St. (150) |
13 - 10 |
18 - 14 |
13.0 - 10.0 |
18.0 - 14.0 |
| | 100.0 | | | | | | | | | |
| 4. |
Louisiana Tech (214) |
13 - 10 |
17 - 14 |
13.0 - 10.0 |
17.0 - 14.0 |
| | | 100.0 | | | | | | | | |
| 5. |
Western Kentucky (163) |
11 - 10 |
16 - 14 |
11.0 - 10.0 |
16.0 - 14.0 |
| | | | 100.0 | | | | | | | |
| 6. |
Middle Tennessee (162) |
11 - 10 |
14 - 15 |
11.0 - 10.0 |
14.0 - 15.0 |
| | | | | 100.0 | | | | | | |
| 7. |
Jacksonville St. (213) |
10 - 11 |
12 - 17 |
10.0 - 11.0 |
12.0 - 17.0 |
| | | | | | 100.0 | | | | | |
| 8. |
Missouri St. (202) |
10 - 13 |
13 - 18 |
10.0 - 13.0 |
13.0 - 18.0 |
| | | | | | | 100.0 | | | | |
| 9. |
New Mexico St. (187) |
9 - 13 |
13 - 16 |
9.0 - 13.0 |
13.0 - 16.0 |
| | | | | | | | 100.0 | | | |
| 10. |
FIU (193) |
8 - 13 |
12 - 17 |
8.0 - 13.0 |
12.0 - 17.0 |
| | | | | | | | | 100.0 | | |
| 11. |
UTEP (267) |
7 - 13 |
8 - 20 |
7.0 - 13.0 |
8.0 - 20.0 |
| | | | | | | | | | 100.0 | |
| 12. |
Delaware (288) |
6 - 14 |
10 - 20 |
6.0 - 14.0 |
10.0 - 20.0 |
| | | | | | | | | | | 100.0 |
Weekly Changes |
| 1. |
Liberty (121) |
|
+0.0 | +0.0 | +0.0 | +0.0 | +0.0 | +0.0 | +0.0 | +0.0 | +0.0 | +0.0 | +0.0 | +0.0 |
| 2. |
Sam Houston St. (116) |
|
+0.0 | +0.0 | +0.0 | +0.0 | +0.0 | +0.0 | +0.0 | +0.0 | +0.0 | +0.0 | +0.0 | +0.0 |
| 3. |
Kennesaw St. (150) |
|
+0.0 | +0.0 | +0.0 | +0.0 | +0.0 | +0.0 | +0.0 | +0.0 | +0.0 | +0.0 | +0.0 | +0.0 |
| 4. |
Louisiana Tech (214) |
|
+0.0 | +0.0 | +0.0 | +0.0 | +0.0 | +0.0 | +0.0 | +0.0 | +0.0 | +0.0 | +0.0 | +0.0 |
| 5. |
Western Kentucky (163) |
|
+0.0 | +0.0 | +0.0 | +0.0 | +0.0 | +0.0 | +0.0 | +0.0 | +0.0 | +0.0 | +0.0 | +0.0 |
| 6. |
Middle Tennessee (162) |
|
+0.0 | +0.0 | +0.0 | +0.0 | +0.0 | +0.0 | +0.0 | +0.0 | +0.0 | +0.0 | +0.0 | +0.0 |
| 7. |
Jacksonville St. (213) |
|
+0.0 | +0.0 | +0.0 | +0.0 | +0.0 | +0.0 | +0.0 | +0.0 | +0.0 | +0.0 | +0.0 | +0.0 |
| 8. |
Missouri St. (202) |
|
+0.0 | +0.0 | +0.0 | +0.0 | +0.0 | +0.0 | +0.0 | +0.0 | +0.0 | +0.0 | +0.0 | +0.0 |
| 9. |
New Mexico St. (187) |
|
+0.0 | +0.0 | +0.0 | +0.0 | +0.0 | +0.0 | +0.0 | +0.0 | +0.0 | +0.0 | +0.0 | +0.0 |
| 10. |
FIU (193) |
|
+0.0 | +0.0 | +0.0 | +0.0 | +0.0 | +0.0 | +0.0 | +0.0 | +0.0 | +0.0 | +0.0 | +0.0 |
| 11. |
UTEP (267) |
|
+0.0 | +0.0 | +0.0 | +0.0 | +0.0 | +0.0 | +0.0 | +0.0 | +0.0 | +0.0 | +0.0 | +0.0 |
| 12. |
Delaware (288) |
|
+0.0 | +0.0 | +0.0 | +0.0 | +0.0 | +0.0 | +0.0 | +0.0 | +0.0 | +0.0 | +0.0 | +0.0 |
This table gives the probability of earning at least a share of a given place.
So there are no tiebreakers and there can be multiple first place teams, for example.
This Week's Games
| Date |
Away |
W Prob, Pred Score |
Home |