Metro Atlantic
Updated with games through Friday, March 27
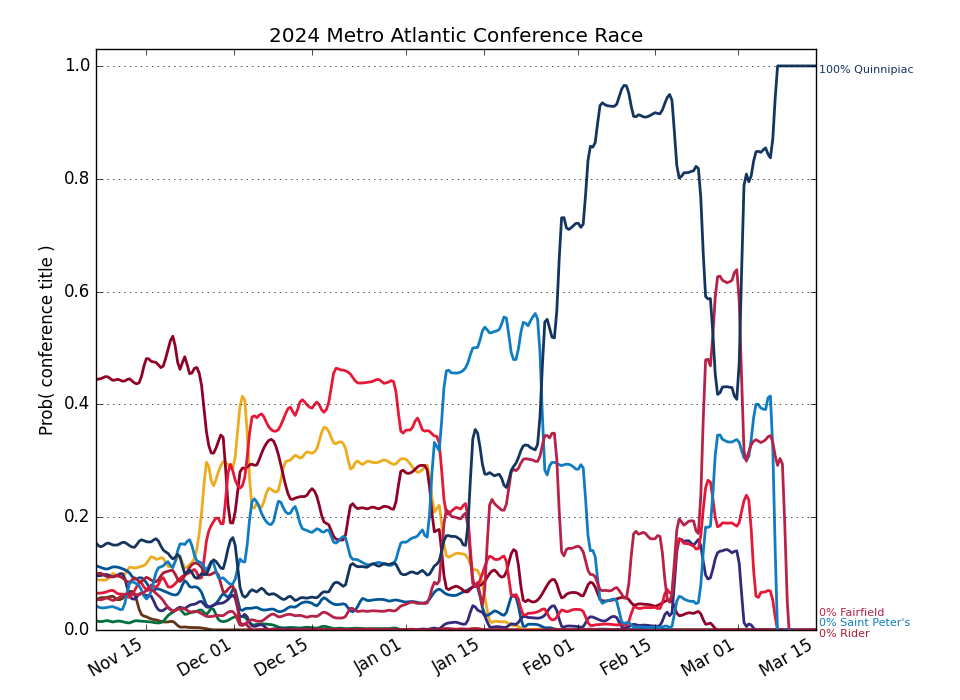
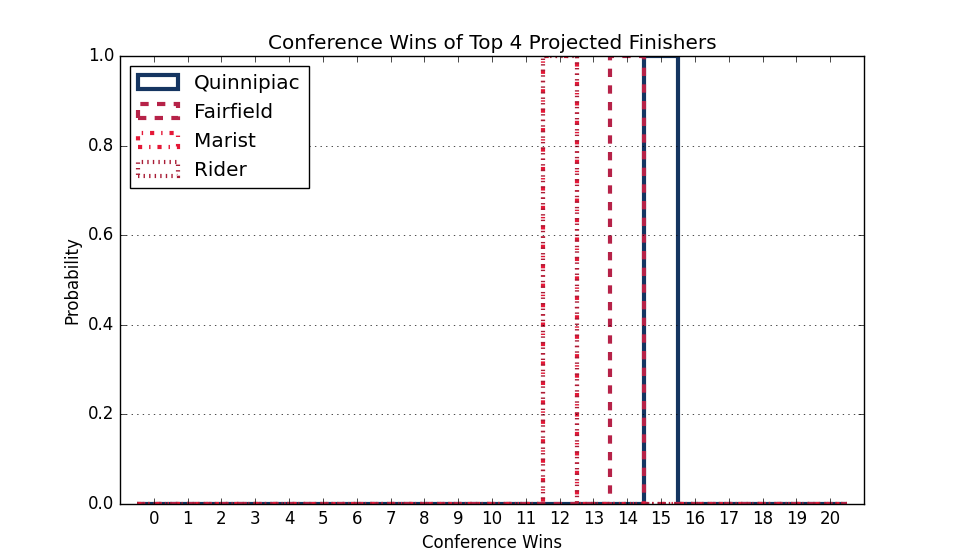
Conference Projections
Based on 10,000 simulations of the remaining season.
Tiebreaking was done using the
Big Ten tiebreaking procedures.
| Metro Atlantic |
Current Record |
Projected Record |
Projected Finish (% odds, with tiebreakers) |
|
Team |
Conf. |
Overall |
Conf. |
Overall |
1st | 2nd | 3rd | 4th | 5th | 6th | 7th | 8th | 9th | 10th | 11th | 12th | 13th |
| 1. |
Merrimack (208) |
19 - 4 |
23 - 11 |
19.0 - 4.0 |
23.0 - 11.0 |
100.0 | | | | | | | | | | | | |
| 2. |
Siena (194) |
16 - 7 |
23 - 12 |
16.0 - 7.0 |
23.0 - 12.0 |
| 100.0 | | | | | | | | | | | |
| 3. |
Saint Peter's (256) |
14 - 7 |
16 - 12 |
14.0 - 7.0 |
16.0 - 12.0 |
| | 100.0 | | | | | | | | | | |
| 4. |
Marist (180) |
13 - 9 |
18 - 12 |
13.0 - 9.0 |
18.0 - 12.0 |
| | | 100.0 | | | | | | | | | |
| 5. |
Quinnipiac (231) |
12 - 9 |
18 - 13 |
12.0 - 9.0 |
18.0 - 13.0 |
| | | | 100.0 | | | | | | | | |
| 6. |
Fairfield (262) |
13 - 10 |
20 - 13 |
13.0 - 10.0 |
20.0 - 13.0 |
| | | | | 100.0 | | | | | | | |
| 7. |
Mount St. Mary's (290) |
11 - 10 |
14 - 17 |
11.0 - 10.0 |
14.0 - 17.0 |
| | | | | | 100.0 | | | | | | |
| 8. |
Iona (257) |
10 - 11 |
18 - 14 |
10.0 - 11.0 |
18.0 - 14.0 |
| | | | | | | 100.0 | | | | | |
| 9. |
Sacred Heart (308) |
10 - 12 |
13 - 19 |
10.0 - 12.0 |
13.0 - 19.0 |
| | | | | | | | 100.0 | | | | |
| 10. |
Manhattan (334) |
8 - 13 |
11 - 20 |
8.0 - 13.0 |
11.0 - 20.0 |
| | | | | | | | | 100.0 | | | |
| 11. |
Niagara (346) |
5 - 15 |
7 - 22 |
5.0 - 15.0 |
7.0 - 22.0 |
| | | | | | | | | | 100.0 | | |
| 12. |
Canisius (349) |
5 - 15 |
9 - 21 |
5.0 - 15.0 |
9.0 - 21.0 |
| | | | | | | | | | | 100.0 | |
| 13. |
Rider (356) |
3 - 17 |
3 - 25 |
3.0 - 17.0 |
3.0 - 25.0 |
| | | | | | | | | | | | 100.0 |
Weekly Changes |
| 1. |
Merrimack (208) |
|
+0.0 | +0.0 | +0.0 | +0.0 | +0.0 | +0.0 | +0.0 | +0.0 | +0.0 | +0.0 | +0.0 | +0.0 | +0.0 |
| 2. |
Siena (194) |
|
+0.0 | +0.0 | +0.0 | +0.0 | +0.0 | +0.0 | +0.0 | +0.0 | +0.0 | +0.0 | +0.0 | +0.0 | +0.0 |
| 3. |
Saint Peter's (256) |
|
+0.0 | +0.0 | +0.0 | +0.0 | +0.0 | +0.0 | +0.0 | +0.0 | +0.0 | +0.0 | +0.0 | +0.0 | +0.0 |
| 4. |
Marist (180) |
|
+0.0 | +0.0 | +0.0 | +0.0 | +0.0 | +0.0 | +0.0 | +0.0 | +0.0 | +0.0 | +0.0 | +0.0 | +0.0 |
| 5. |
Quinnipiac (231) |
|
+0.0 | +0.0 | +0.0 | +0.0 | +0.0 | +0.0 | +0.0 | +0.0 | +0.0 | +0.0 | +0.0 | +0.0 | +0.0 |
| 6. |
Fairfield (262) |
|
+0.0 | +0.0 | +0.0 | +0.0 | +0.0 | +0.0 | +0.0 | +0.0 | +0.0 | +0.0 | +0.0 | +0.0 | +0.0 |
| 7. |
Mount St. Mary's (290) |
|
+0.0 | +0.0 | +0.0 | +0.0 | +0.0 | +0.0 | +0.0 | +0.0 | +0.0 | +0.0 | +0.0 | +0.0 | +0.0 |
| 8. |
Iona (257) |
|
+0.0 | +0.0 | +0.0 | +0.0 | +0.0 | +0.0 | +0.0 | +0.0 | +0.0 | +0.0 | +0.0 | +0.0 | +0.0 |
| 9. |
Sacred Heart (308) |
|
+0.0 | +0.0 | +0.0 | +0.0 | +0.0 | +0.0 | +0.0 | +0.0 | +0.0 | +0.0 | +0.0 | +0.0 | +0.0 |
| 10. |
Manhattan (334) |
|
+0.0 | +0.0 | +0.0 | +0.0 | +0.0 | +0.0 | +0.0 | +0.0 | +0.0 | +0.0 | +0.0 | +0.0 | +0.0 |
| 11. |
Niagara (346) |
|
+0.0 | +0.0 | +0.0 | +0.0 | +0.0 | +0.0 | +0.0 | +0.0 | +0.0 | +0.0 | +0.0 | +0.0 | +0.0 |
| 12. |
Canisius (349) |
|
+0.0 | +0.0 | +0.0 | +0.0 | +0.0 | +0.0 | +0.0 | +0.0 | +0.0 | +0.0 | +0.0 | +0.0 | +0.0 |
| 13. |
Rider (356) |
|
+0.0 | +0.0 | +0.0 | +0.0 | +0.0 | +0.0 | +0.0 | +0.0 | +0.0 | +0.0 | +0.0 | +0.0 | +0.0 |
This table gives the probability of earning at least a share of a given place.
So there are no tiebreakers and there can be multiple first place teams, for example.
This Week's Games
| Date |
Away |
W Prob, Pred Score |
Home |