Mid-American
Updated with games through Friday, March 27
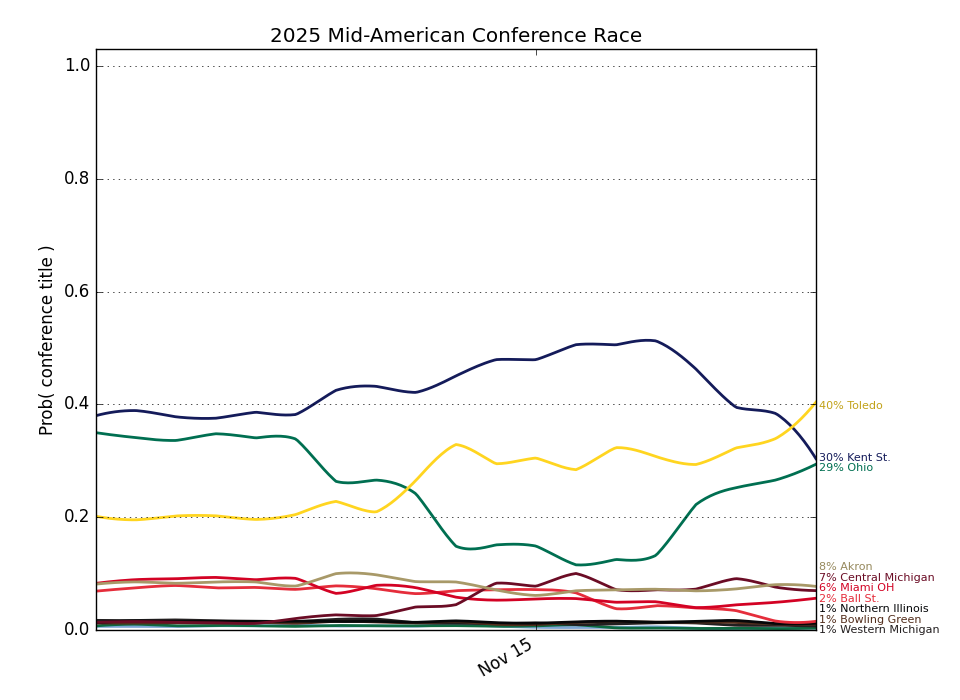
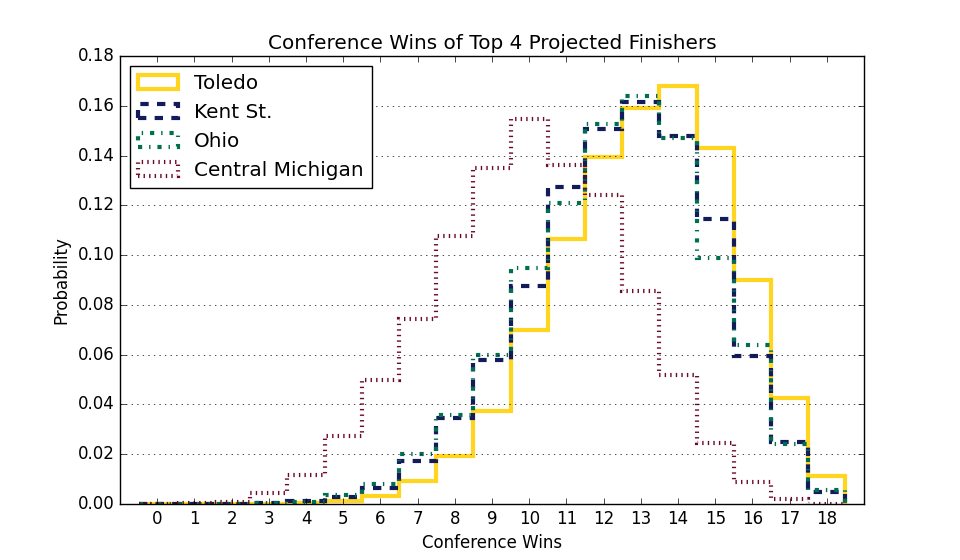
Conference Projections
Based on 10,000 simulations of the remaining season.
Tiebreaking was done using the
Big Ten tiebreaking procedures.
| Mid-American |
Current Record |
Projected Record |
Projected Finish (% odds, with tiebreakers) |
|
Team |
Conf. |
Overall |
Conf. |
Overall |
1st | 2nd | 3rd | 4th | 5th | 6th | 7th | 8th | 9th | 10th | 11th | 12th | 13th |
| 1. |
Akron (67) |
20 - 1 |
27 - 6 |
20.0 - 1.0 |
27.0 - 6.0 |
100.0 | | | | | | | | | | | | |
| 2. |
Miami OH (91) |
18 - 1 |
29 - 2 |
18.0 - 1.0 |
29.0 - 2.0 |
| 100.0 | | | | | | | | | | | |
| 3. |
Kent St. (171) |
15 - 5 |
22 - 10 |
15.0 - 5.0 |
22.0 - 10.0 |
| | 100.0 | | | | | | | | | | |
| 4. |
Toledo (142) |
13 - 8 |
17 - 15 |
13.0 - 8.0 |
17.0 - 15.0 |
| | | 100.0 | | | | | | | | | |
| 5. |
Bowling Green (168) |
9 - 10 |
15 - 14 |
9.0 - 10.0 |
15.0 - 14.0 |
| | | | 100.0 | | | | | | | | |
| 6. |
Ohio (238) |
9 - 10 |
13 - 17 |
9.0 - 10.0 |
13.0 - 17.0 |
| | | | | 100.0 | | | | | | | |
| 7. |
Massachusetts (212) |
8 - 12 |
16 - 16 |
8.0 - 12.0 |
16.0 - 16.0 |
| | | | | | 100.0 | | | | | | |
| 8. |
Ball St. (296) |
7 - 11 |
10 - 19 |
7.0 - 11.0 |
10.0 - 19.0 |
| | | | | | | 100.0 | | | | | |
| 9. |
Buffalo (201) |
7 - 12 |
15 - 15 |
7.0 - 12.0 |
15.0 - 15.0 |
| | | | | | | | 100.0 | | | | |
| 10. |
Central Michigan (277) |
6 - 12 |
8 - 21 |
6.0 - 12.0 |
8.0 - 21.0 |
| | | | | | | | | 100.0 | | | |
| 11. |
Western Michigan (285) |
4 - 14 |
9 - 20 |
4.0 - 14.0 |
9.0 - 20.0 |
| | | | | | | | | | 100.0 | | |
| 12. |
Northern Illinois (337) |
4 - 14 |
7 - 21 |
4.0 - 14.0 |
7.0 - 21.0 |
| | | | | | | | | | | 100.0 | |
| 13. |
Eastern Michigan (233) |
4 - 14 |
9 - 21 |
4.0 - 14.0 |
9.0 - 21.0 |
| | | | | | | | | | | | 100.0 |
Weekly Changes |
| 1. |
Akron (67) |
|
+0.0 | +0.0 | +0.0 | +0.0 | +0.0 | +0.0 | +0.0 | +0.0 | +0.0 | +0.0 | +0.0 | +0.0 | +0.0 |
| 2. |
Miami OH (91) |
|
+0.0 | +0.0 | +0.0 | +0.0 | +0.0 | +0.0 | +0.0 | +0.0 | +0.0 | +0.0 | +0.0 | +0.0 | +0.0 |
| 3. |
Kent St. (171) |
|
+0.0 | +0.0 | +0.0 | +0.0 | +0.0 | +0.0 | +0.0 | +0.0 | +0.0 | +0.0 | +0.0 | +0.0 | +0.0 |
| 4. |
Toledo (142) |
|
+0.0 | +0.0 | +0.0 | +0.0 | +0.0 | +0.0 | +0.0 | +0.0 | +0.0 | +0.0 | +0.0 | +0.0 | +0.0 |
| 5. |
Bowling Green (168) |
|
+0.0 | +0.0 | +0.0 | +0.0 | +0.0 | +0.0 | +0.0 | +0.0 | +0.0 | +0.0 | +0.0 | +0.0 | +0.0 |
| 6. |
Ohio (238) |
|
+0.0 | +0.0 | +0.0 | +0.0 | +0.0 | +0.0 | +0.0 | +0.0 | +0.0 | +0.0 | +0.0 | +0.0 | +0.0 |
| 7. |
Massachusetts (212) |
|
+0.0 | +0.0 | +0.0 | +0.0 | +0.0 | +0.0 | +0.0 | +0.0 | +0.0 | +0.0 | +0.0 | +0.0 | +0.0 |
| 8. |
Ball St. (296) |
|
+0.0 | +0.0 | +0.0 | +0.0 | +0.0 | +0.0 | +0.0 | +0.0 | +0.0 | +0.0 | +0.0 | +0.0 | +0.0 |
| 9. |
Buffalo (201) |
|
+0.0 | +0.0 | +0.0 | +0.0 | +0.0 | +0.0 | +0.0 | +0.0 | +0.0 | +0.0 | +0.0 | +0.0 | +0.0 |
| 10. |
Central Michigan (277) |
|
+0.0 | +0.0 | +0.0 | +0.0 | +0.0 | +0.0 | +0.0 | +0.0 | +0.0 | +0.0 | +0.0 | +0.0 | +0.0 |
| 11. |
Western Michigan (285) |
|
+0.0 | +0.0 | +0.0 | +0.0 | +0.0 | +0.0 | +0.0 | +0.0 | +0.0 | +0.0 | +0.0 | +0.0 | +0.0 |
| 12. |
Northern Illinois (337) |
|
+0.0 | +0.0 | +0.0 | +0.0 | +0.0 | +0.0 | +0.0 | +0.0 | +0.0 | +0.0 | +0.0 | +0.0 | +0.0 |
| 13. |
Eastern Michigan (233) |
|
+0.0 | +0.0 | +0.0 | +0.0 | +0.0 | +0.0 | +0.0 | +0.0 | +0.0 | +0.0 | +0.0 | +0.0 | +0.0 |
This table gives the probability of earning at least a share of a given place.
So there are no tiebreakers and there can be multiple first place teams, for example.
This Week's Games
| Date |
Away |
W Prob, Pred Score |
Home |