| Mid-Eastern |
Current Record |
Projected Record |
Projected Finish (% odds, with tiebreakers) |
|
Team |
Conf. |
Overall |
Conf. |
Overall |
1st | 2nd | 3rd | 4th | 5th | 6th | 7th | 8th |
| 1. |
Howard (196) |
13 - 3 |
20 - 11 |
13.0 - 3.0 |
20.0 - 11.0 |
100.0 | | | | | | | |
| 2. |
Morgan St. (357) |
10 - 5 |
11 - 16 |
10.0 - 5.0 |
11.0 - 16.0 |
| 100.0 | | | | | | |
| 3. |
North Carolina Central (348) |
10 - 7 |
10 - 18 |
10.0 - 7.0 |
10.0 - 18.0 |
| | 100.0 | | | | | |
| 4. |
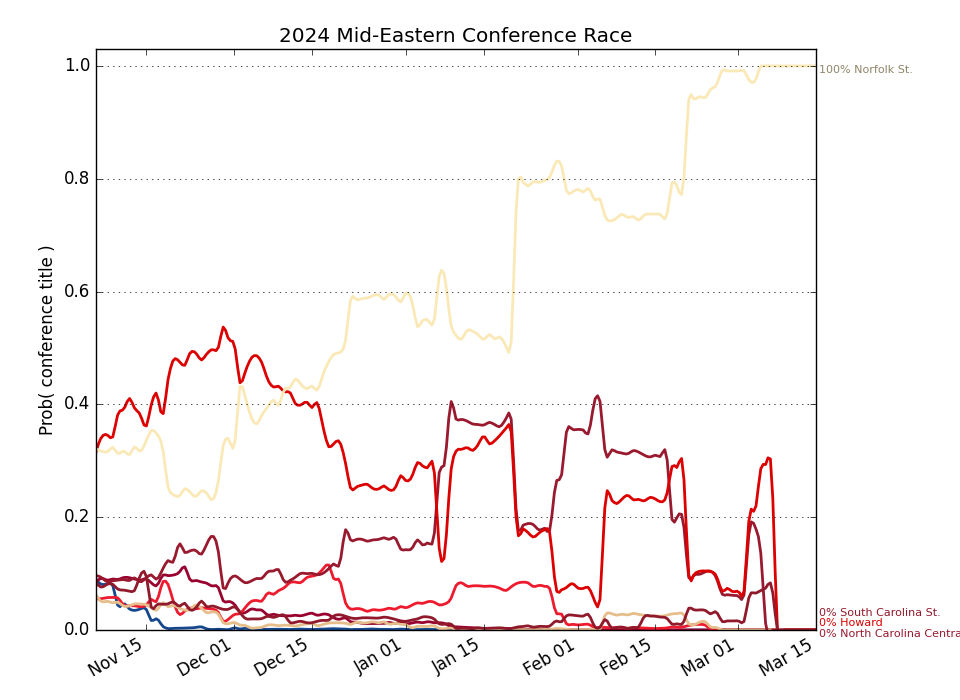
Norfolk St. (320) |
8 - 7 |
11 - 17 |
8.0 - 7.0 |
11.0 - 17.0 |
| | | 100.0 | | | | |
| 5. |
South Carolina St. (359) |
8 - 8 |
8 - 22 |
8.0 - 8.0 |
8.0 - 22.0 |
| | | | 100.0 | | | |
| 6. |
Coppin St. (364) |
5 - 9 |
6 - 24 |
5.0 - 9.0 |
6.0 - 24.0 |
| | | | | 100.0 | | |
| 7. |
Md Eastern Shore (347) |
5 - 10 |
7 - 23 |
5.0 - 10.0 |
7.0 - 23.0 |
| | | | | | 100.0 | |
| 8. |
Delaware St. (362) |
3 - 13 |
5 - 22 |
3.0 - 13.0 |
5.0 - 22.0 |
| | | | | | | 100.0 |
Weekly Changes |
| 1. |
Howard (196) |
|
+0.0 | +0.0 | +0.0 | +0.0 | +0.0 | +0.0 | +0.0 | +0.0 |
| 2. |
Morgan St. (357) |
|
+0.0 | +0.0 | +0.0 | +0.0 | +0.0 | +0.0 | +0.0 | +0.0 |
| 3. |
North Carolina Central (348) |
|
+0.0 | +0.0 | +0.0 | +0.0 | +0.0 | +0.0 | +0.0 | +0.0 |
| 4. |
Norfolk St. (320) |
|
+0.0 | +0.0 | +0.0 | +0.0 | +0.0 | +0.0 | +0.0 | +0.0 |
| 5. |
South Carolina St. (359) |
|
+0.0 | +0.0 | +0.0 | +0.0 | +0.0 | +0.0 | +0.0 | +0.0 |
| 6. |
Coppin St. (364) |
|
+0.0 | +0.0 | +0.0 | +0.0 | +0.0 | +0.0 | +0.0 | +0.0 |
| 7. |
Md Eastern Shore (347) |
|
+0.0 | +0.0 | +0.0 | +0.0 | +0.0 | +0.0 | +0.0 | +0.0 |
| 8. |
Delaware St. (362) |
|
+0.0 | +0.0 | +0.0 | +0.0 | +0.0 | +0.0 | +0.0 | +0.0 |