Missouri Valley
Updated with games through Friday, March 27
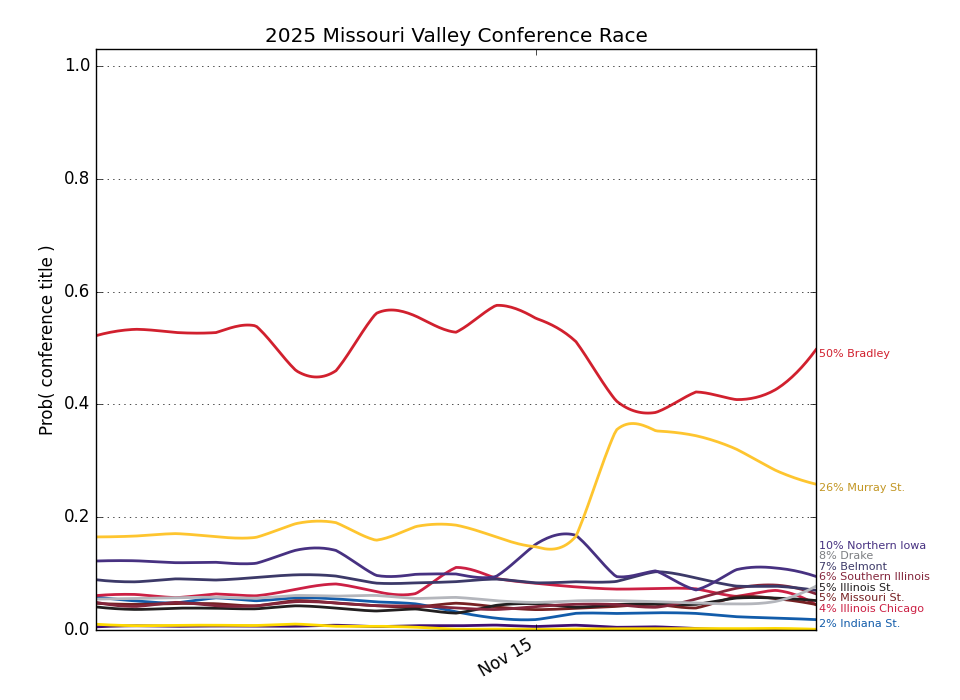
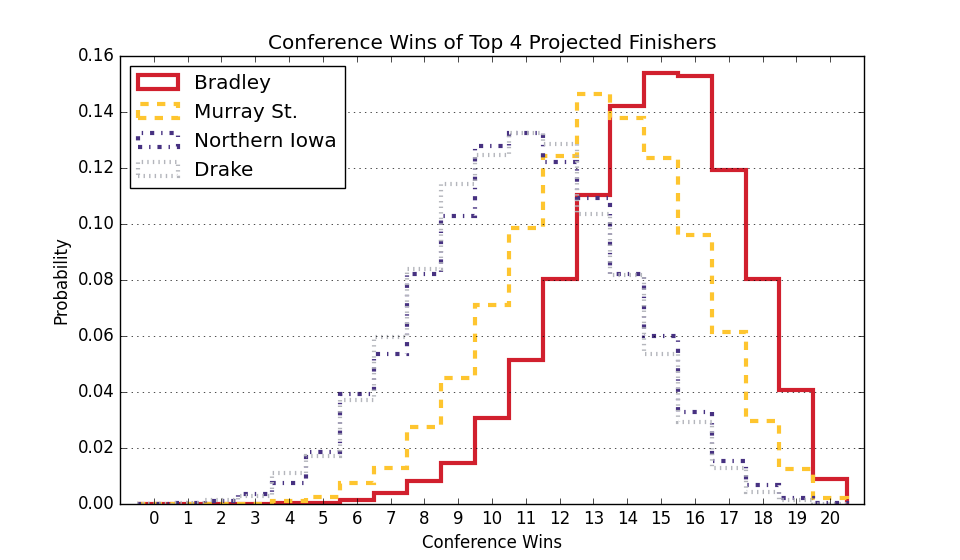
Conference Projections
Based on 10,000 simulations of the remaining season.
Tiebreaking was done using the
Big Ten tiebreaking procedures.
| Missouri Valley |
Current Record |
Projected Record |
Projected Finish (% odds, with tiebreakers) |
|
Team |
Conf. |
Overall |
Conf. |
Overall |
1st | 2nd | 3rd | 4th | 5th | 6th | 7th | 8th | 9th | 10th | 11th |
| 1. |
Belmont (72) |
16 - 5 |
25 - 6 |
16.0 - 5.0 |
25.0 - 6.0 |
100.0 | | | | | | | | | | |
| 2. |
Bradley (119) |
14 - 8 |
20 - 13 |
14.0 - 8.0 |
20.0 - 13.0 |
| 100.0 | | | | | | | | | |
| 3. |
Northern Iowa (78) |
15 - 9 |
22 - 13 |
15.0 - 9.0 |
22.0 - 13.0 |
| | 100.0 | | | | | | | | |
| 4. |
Illinois Chicago (110) |
14 - 9 |
17 - 16 |
14.0 - 9.0 |
17.0 - 16.0 |
| | | 100.0 | | | | | | | |
| 5. |
Illinois St. (87) |
12 - 9 |
22 - 12 |
12.0 - 9.0 |
22.0 - 12.0 |
| | | | 100.0 | | | | | | |
| 6. |
Murray St. (111) |
12 - 9 |
20 - 13 |
12.0 - 9.0 |
20.0 - 13.0 |
| | | | | 100.0 | | | | | |
| 7. |
Valparaiso (159) |
12 - 10 |
17 - 15 |
12.0 - 10.0 |
17.0 - 15.0 |
| | | | | | 100.0 | | | | |
| 8. |
Southern Illinois (115) |
10 - 11 |
15 - 16 |
10.0 - 11.0 |
15.0 - 16.0 |
| | | | | | | 100.0 | | | |
| 9. |
Drake (184) |
8 - 15 |
12 - 20 |
8.0 - 15.0 |
12.0 - 20.0 |
| | | | | | | | 100.0 | | |
| 10. |
Indiana St. (198) |
4 - 17 |
9 - 21 |
4.0 - 17.0 |
9.0 - 21.0 |
| | | | | | | | | 100.0 | |
| 11. |
Evansville (298) |
3 - 18 |
5 - 25 |
3.0 - 18.0 |
5.0 - 25.0 |
| | | | | | | | | | 100.0 |
Weekly Changes |
| 1. |
Belmont (72) |
|
+0.0 | +0.0 | +0.0 | +0.0 | +0.0 | +0.0 | +0.0 | +0.0 | +0.0 | +0.0 | +0.0 |
| 2. |
Bradley (119) |
|
+0.0 | +0.0 | +0.0 | +0.0 | +0.0 | +0.0 | +0.0 | +0.0 | +0.0 | +0.0 | +0.0 |
| 3. |
Northern Iowa (78) |
|
+0.0 | +0.0 | +0.0 | +0.0 | +0.0 | +0.0 | +0.0 | +0.0 | +0.0 | +0.0 | +0.0 |
| 4. |
Illinois Chicago (110) |
|
+0.0 | +0.0 | +0.0 | +0.0 | +0.0 | +0.0 | +0.0 | +0.0 | +0.0 | +0.0 | +0.0 |
| 5. |
Illinois St. (87) |
|
+0.0 | +0.0 | +0.0 | +0.0 | +0.0 | +0.0 | +0.0 | +0.0 | +0.0 | +0.0 | +0.0 |
| 6. |
Murray St. (111) |
|
+0.0 | +0.0 | +0.0 | +0.0 | +0.0 | +0.0 | +0.0 | +0.0 | +0.0 | +0.0 | +0.0 |
| 7. |
Valparaiso (159) |
|
+0.0 | +0.0 | +0.0 | +0.0 | +0.0 | +0.0 | +0.0 | +0.0 | +0.0 | +0.0 | +0.0 |
| 8. |
Southern Illinois (115) |
|
+0.0 | +0.0 | +0.0 | +0.0 | +0.0 | +0.0 | +0.0 | +0.0 | +0.0 | +0.0 | +0.0 |
| 9. |
Drake (184) |
|
+0.0 | +0.0 | +0.0 | +0.0 | +0.0 | +0.0 | +0.0 | +0.0 | +0.0 | +0.0 | +0.0 |
| 10. |
Indiana St. (198) |
|
+0.0 | +0.0 | +0.0 | +0.0 | +0.0 | +0.0 | +0.0 | +0.0 | +0.0 | +0.0 | +0.0 |
| 11. |
Evansville (298) |
|
+0.0 | +0.0 | +0.0 | +0.0 | +0.0 | +0.0 | +0.0 | +0.0 | +0.0 | +0.0 | +0.0 |
This table gives the probability of earning at least a share of a given place.
So there are no tiebreakers and there can be multiple first place teams, for example.