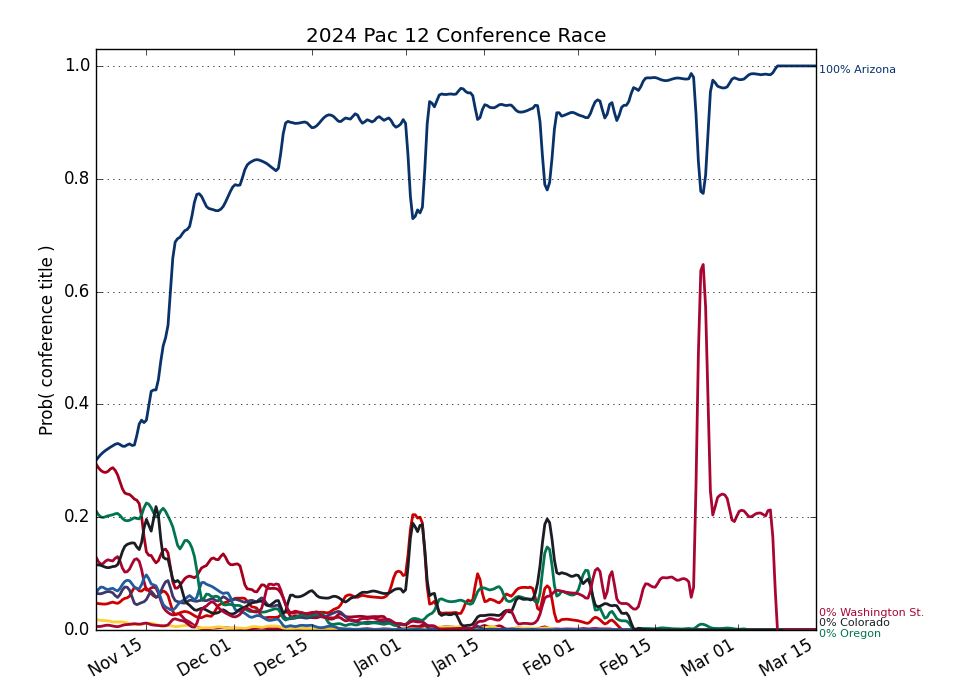
Pac 12
Updated with games through Monday, April 08
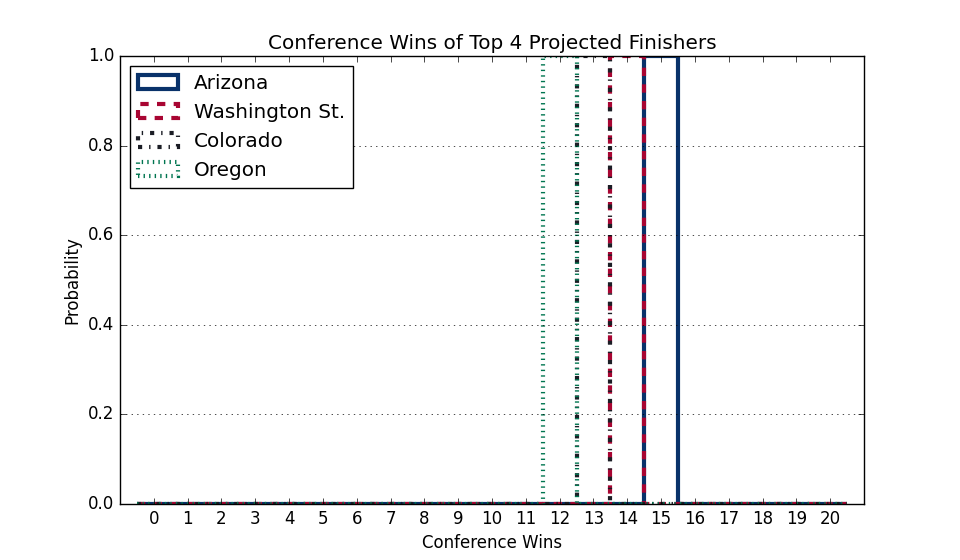
Conference Projections
Based on 10,000 simulations of the remaining season.
Tiebreaking was done using the
Big Ten tiebreaking procedures.
| Pac 12 |
Current Record |
Projected Record |
Projected Finish (% odds, with tiebreakers) |
|
Team |
Conf. |
Overall |
Conf. |
Overall |
1st | 2nd | 3rd | 4th | 5th | 6th | 7th | 8th | 9th | 10th | 11th | 12th |
| 1. |
Arizona (4) |
15 - 5 |
27 - 9 |
15.0 - 5.0 |
27.0 - 9.0 |
100.0 | | | | | | | | | | | |
| 2. |
Washington St. (37) |
14 - 6 |
25 - 10 |
14.0 - 6.0 |
25.0 - 10.0 |
| 100.0 | | | | | | | | | | |
| 3. |
Colorado (22) |
13 - 7 |
26 - 11 |
13.0 - 7.0 |
26.0 - 11.0 |
| | 100.0 | | | | | | | | | |
| 4. |
Oregon (56) |
12 - 8 |
24 - 12 |
12.0 - 8.0 |
24.0 - 12.0 |
| | | 100.0 | | | | | | | | |
| 5. |
UCLA (108) |
11 - 10 |
16 - 17 |
11.0 - 10.0 |
16.0 - 17.0 |
| | | | 100.0 | | | | | | | |
| 6. |
Utah (44) |
9 - 11 |
22 - 15 |
9.0 - 11.0 |
22.0 - 15.0 |
| | | | | 100.0 | | | | | | |
| 7. |
Washington (66) |
9 - 11 |
17 - 15 |
9.0 - 11.0 |
17.0 - 15.0 |
| | | | | | 100.0 | | | | | |
| 8. |
California (121) |
9 - 11 |
13 - 19 |
9.0 - 11.0 |
13.0 - 19.0 |
| | | | | | | 100.0 | | | | |
| 9. |
Stanford (100) |
8 - 12 |
14 - 18 |
8.0 - 12.0 |
14.0 - 18.0 |
| | | | | | | | 100.0 | | | |
| 10. |
USC (73) |
8 - 12 |
15 - 18 |
8.0 - 12.0 |
15.0 - 18.0 |
| | | | | | | | | 100.0 | | |
| 11. |
Arizona St. (132) |
8 - 13 |
14 - 19 |
8.0 - 13.0 |
14.0 - 19.0 |
| | | | | | | | | | 100.0 | |
| 12. |
Oregon St. (149) |
5 - 15 |
12 - 19 |
5.0 - 15.0 |
12.0 - 19.0 |
| | | | | | | | | | | 100.0 |
Weekly Changes |
| 1. |
Arizona (4) |
|
+0.0 | +0.0 | +0.0 | +0.0 | +0.0 | +0.0 | +0.0 | +0.0 | +0.0 | +0.0 | +0.0 | +0.0 |
| 2. |
Washington St. (37) |
|
+0.0 | +0.0 | +0.0 | +0.0 | +0.0 | +0.0 | +0.0 | +0.0 | +0.0 | +0.0 | +0.0 | +0.0 |
| 3. |
Colorado (22) |
|
+0.0 | +0.0 | +0.0 | +0.0 | +0.0 | +0.0 | +0.0 | +0.0 | +0.0 | +0.0 | +0.0 | +0.0 |
| 4. |
Oregon (56) |
|
+0.0 | +0.0 | +0.0 | +0.0 | +0.0 | +0.0 | +0.0 | +0.0 | +0.0 | +0.0 | +0.0 | +0.0 |
| 5. |
UCLA (108) |
|
+0.0 | +0.0 | +0.0 | +0.0 | +0.0 | +0.0 | +0.0 | +0.0 | +0.0 | +0.0 | +0.0 | +0.0 |
| 6. |
Utah (44) |
|
+0.0 | +0.0 | +0.0 | +0.0 | +0.0 | +0.0 | +0.0 | +0.0 | +0.0 | +0.0 | +0.0 | +0.0 |
| 7. |
Washington (66) |
|
+0.0 | +0.0 | +0.0 | +0.0 | +0.0 | +0.0 | +0.0 | +0.0 | +0.0 | +0.0 | +0.0 | +0.0 |
| 8. |
California (121) |
|
+0.0 | +0.0 | +0.0 | +0.0 | +0.0 | +0.0 | +0.0 | +0.0 | +0.0 | +0.0 | +0.0 | +0.0 |
| 9. |
Stanford (100) |
|
+0.0 | +0.0 | +0.0 | +0.0 | +0.0 | +0.0 | +0.0 | +0.0 | +0.0 | +0.0 | +0.0 | +0.0 |
| 10. |
USC (73) |
|
+0.0 | +0.0 | +0.0 | +0.0 | +0.0 | +0.0 | +0.0 | +0.0 | +0.0 | +0.0 | +0.0 | +0.0 |
| 11. |
Arizona St. (132) |
|
+0.0 | +0.0 | +0.0 | +0.0 | +0.0 | +0.0 | +0.0 | +0.0 | +0.0 | +0.0 | +0.0 | +0.0 |
| 12. |
Oregon St. (149) |
|
+0.0 | +0.0 | +0.0 | +0.0 | +0.0 | +0.0 | +0.0 | +0.0 | +0.0 | +0.0 | +0.0 | +0.0 |
This table gives the probability of earning at least a share of a given place.
So there are no tiebreakers and there can be multiple first place teams, for example.
This Week's Games
| Date |
Away |
W Prob, Pred Score |
Home |