Southern
Updated with games through Friday, March 27
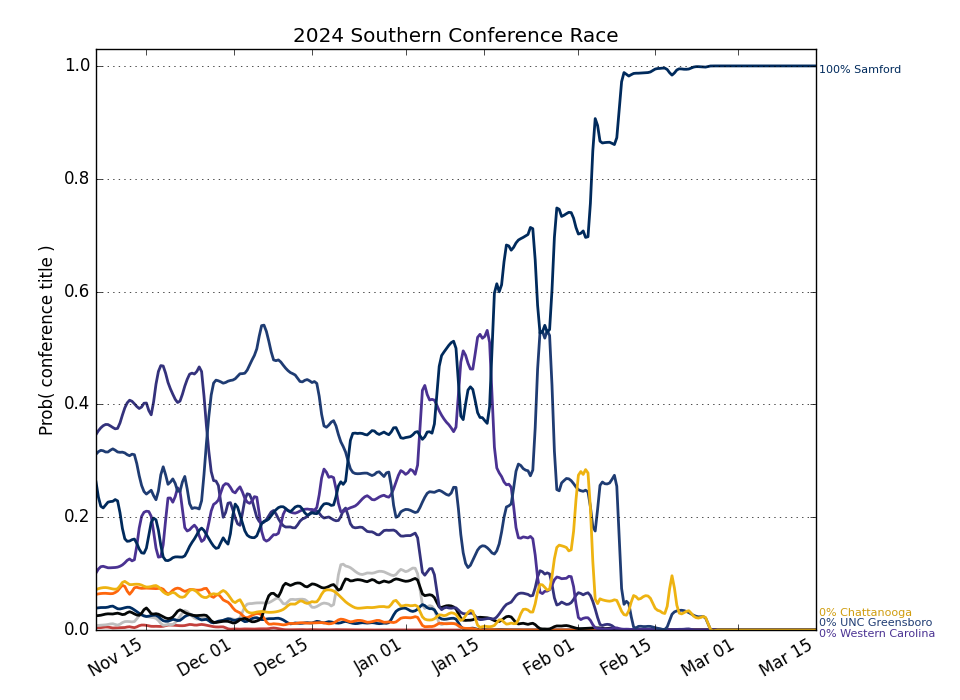
Conference Projections
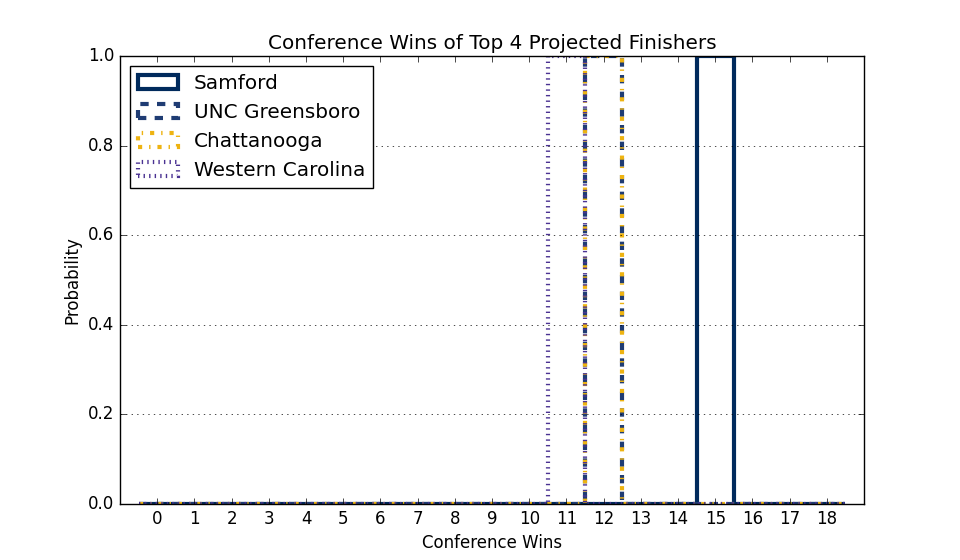
Based on 10,000 simulations of the remaining season.
Tiebreaking was done using the
Big Ten tiebreaking procedures.
| Southern |
Current Record |
Projected Record |
Projected Finish (% odds, with tiebreakers) |
|
Team |
Conf. |
Overall |
Conf. |
Overall |
1st | 2nd | 3rd | 4th | 5th | 6th | 7th | 8th | 9th | 10th |
| 1. |
East Tennessee St. (140) |
15 - 6 |
21 - 11 |
15.0 - 6.0 |
21.0 - 11.0 |
100.0 | | | | | | | | | |
| 2. |
Furman (195) |
13 - 8 |
19 - 13 |
13.0 - 8.0 |
19.0 - 13.0 |
| 100.0 | | | | | | | | |
| 3. |
Wofford (253) |
11 - 8 |
17 - 13 |
11.0 - 8.0 |
17.0 - 13.0 |
| | 100.0 | | | | | | | |
| 4. |
Mercer (183) |
11 - 8 |
16 - 13 |
11.0 - 8.0 |
16.0 - 13.0 |
| | | 100.0 | | | | | | |
| 5. |
Samford (222) |
11 - 8 |
16 - 14 |
11.0 - 8.0 |
16.0 - 14.0 |
| | | | 100.0 | | | | | |
| 6. |
Western Carolina (237) |
11 - 9 |
13 - 16 |
11.0 - 9.0 |
13.0 - 16.0 |
| | | | | 100.0 | | | | |
| 7. |
UNC Greensboro (304) |
11 - 10 |
13 - 19 |
11.0 - 10.0 |
13.0 - 19.0 |
| | | | | | 100.0 | | | |
| 8. |
The Citadel (345) |
8 - 12 |
8 - 22 |
8.0 - 12.0 |
8.0 - 22.0 |
| | | | | | | 100.0 | | |
| 9. |
Chattanooga (289) |
7 - 12 |
10 - 19 |
7.0 - 12.0 |
10.0 - 19.0 |
| | | | | | | | 100.0 | |
| 10. |
VMI (358) |
1 - 18 |
3 - 26 |
1.0 - 18.0 |
3.0 - 26.0 |
| | | | | | | | | 100.0 |
Weekly Changes |
| 1. |
East Tennessee St. (140) |
|
+0.0 | +0.0 | +0.0 | +0.0 | +0.0 | +0.0 | +0.0 | +0.0 | +0.0 | +0.0 |
| 2. |
Furman (195) |
|
+0.0 | +0.0 | +0.0 | +0.0 | +0.0 | +0.0 | +0.0 | +0.0 | +0.0 | +0.0 |
| 3. |
Wofford (253) |
|
+0.0 | +0.0 | +0.0 | +0.0 | +0.0 | +0.0 | +0.0 | +0.0 | +0.0 | +0.0 |
| 4. |
Mercer (183) |
|
+0.0 | +0.0 | +0.0 | +0.0 | +0.0 | +0.0 | +0.0 | +0.0 | +0.0 | +0.0 |
| 5. |
Samford (222) |
|
+0.0 | +0.0 | +0.0 | +0.0 | +0.0 | +0.0 | +0.0 | +0.0 | +0.0 | +0.0 |
| 6. |
Western Carolina (237) |
|
+0.0 | +0.0 | +0.0 | +0.0 | +0.0 | +0.0 | +0.0 | +0.0 | +0.0 | +0.0 |
| 7. |
UNC Greensboro (304) |
|
+0.0 | +0.0 | +0.0 | +0.0 | +0.0 | +0.0 | +0.0 | +0.0 | +0.0 | +0.0 |
| 8. |
The Citadel (345) |
|
+0.0 | +0.0 | +0.0 | +0.0 | +0.0 | +0.0 | +0.0 | +0.0 | +0.0 | +0.0 |
| 9. |
Chattanooga (289) |
|
+0.0 | +0.0 | +0.0 | +0.0 | +0.0 | +0.0 | +0.0 | +0.0 | +0.0 | +0.0 |
| 10. |
VMI (358) |
|
+0.0 | +0.0 | +0.0 | +0.0 | +0.0 | +0.0 | +0.0 | +0.0 | +0.0 | +0.0 |
This table gives the probability of earning at least a share of a given place.
So there are no tiebreakers and there can be multiple first place teams, for example.
This Week's Games
| Date |
Away |
W Prob, Pred Score |
Home |