SEC
Updated with games through Friday, March 27
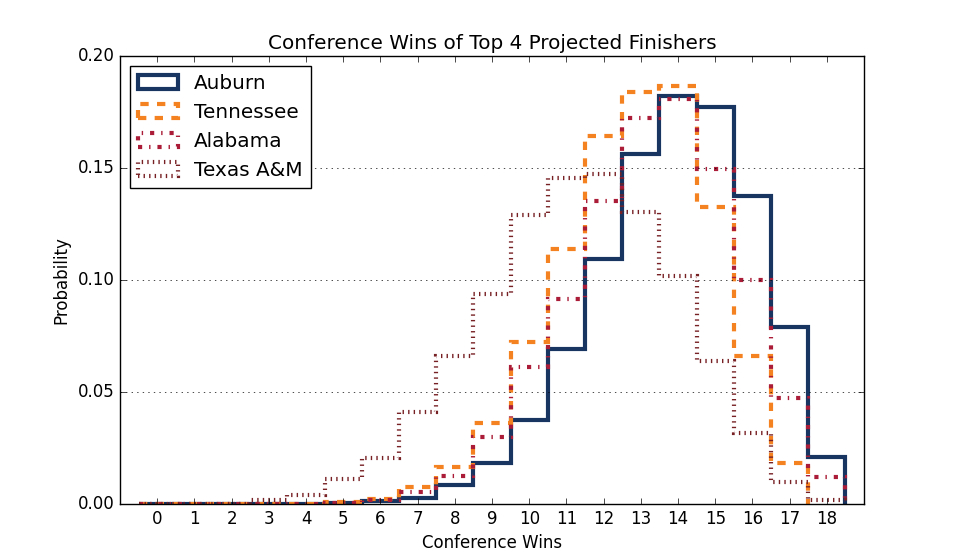
Conference Projections
Based on 10,000 simulations of the remaining season.
Tiebreaking was done using the
Big Ten tiebreaking procedures.
| SEC |
Current Record |
Projected Record |
Projected Finish (% odds, with tiebreakers) |
|
Team |
Conf. |
Overall |
Conf. |
Overall |
1st | 2nd | 3rd | 4th | 5th | 6th | 7th | 8th | 9th | 10th | 11th | 12th | 13th | 14th | 15th | 16th |
| 1. |
Florida (5) |
17 - 3 |
27 - 8 |
17.0 - 3.0 |
27.0 - 8.0 |
100.0 | | | | | | | | | | | | | | | |
| 2. |
Arkansas (18) |
16 - 5 |
28 - 9 |
16.0 - 5.0 |
28.0 - 9.0 |
| 100.0 | | | | | | | | | | | | | | |
| 3. |
Alabama (12) |
13 - 6 |
25 - 10 |
13.0 - 6.0 |
25.0 - 10.0 |
| | 100.0 | | | | | | | | | | | | | |
| 4. |
Vanderbilt (13) |
13 - 8 |
27 - 9 |
13.0 - 8.0 |
27.0 - 9.0 |
| | | 100.0 | | | | | | | | | | | | |
| 5. |
Tennessee (14) |
12 - 8 |
25 - 11 |
12.0 - 8.0 |
25.0 - 11.0 |
| | | | 100.0 | | | | | | | | | | | |
| 6. |
Texas A&M (45) |
11 - 8 |
22 - 12 |
11.0 - 8.0 |
22.0 - 12.0 |
| | | | | 100.0 | | | | | | | | | | |
| 7. |
Kentucky (29) |
12 - 9 |
21 - 15 |
12.0 - 9.0 |
21.0 - 15.0 |
| | | | | | 100.0 | | | | | | | | | |
| 8. |
Georgia (33) |
10 - 9 |
22 - 11 |
10.0 - 9.0 |
22.0 - 11.0 |
| | | | | | | 100.0 | | | | | | | | |
| 9. |
Missouri (58) |
10 - 9 |
20 - 13 |
10.0 - 9.0 |
20.0 - 13.0 |
| | | | | | | | 100.0 | | | | | | | |
| 10. |
Texas (34) |
9 - 10 |
20 - 15 |
9.0 - 10.0 |
20.0 - 15.0 |
| | | | | | | | | 100.0 | | | | | | |
| 11. |
Oklahoma (46) |
9 - 12 |
19 - 15 |
9.0 - 12.0 |
19.0 - 15.0 |
| | | | | | | | | | 100.0 | | | | | |
| 12. |
Auburn (38) |
8 - 12 |
20 - 16 |
8.0 - 12.0 |
20.0 - 16.0 |
| | | | | | | | | | | 100.0 | | | | |
| 13. |
Mississippi (80) |
7 - 15 |
15 - 20 |
7.0 - 15.0 |
15.0 - 20.0 |
| | | | | | | | | | | | 100.0 | | | |
| 14. |
Mississippi St. (108) |
5 - 14 |
13 - 19 |
5.0 - 14.0 |
13.0 - 19.0 |
| | | | | | | | | | | | | 100.0 | | |
| 15. |
South Carolina (100) |
4 - 15 |
13 - 19 |
4.0 - 15.0 |
13.0 - 19.0 |
| | | | | | | | | | | | | | 100.0 | |
| 16. |
LSU (61) |
3 - 16 |
15 - 17 |
3.0 - 16.0 |
15.0 - 17.0 |
| | | | | | | | | | | | | | | 100.0 |
Weekly Changes |
| 1. |
Florida (5) |
|
+0.0 | +0.0 | +0.0 | +0.0 | +0.0 | +0.0 | +0.0 | +0.0 | +0.0 | +0.0 | +0.0 | +0.0 | +0.0 | +0.0 | +0.0 | +0.0 |
| 2. |
Arkansas (18) |
|
+0.0 | +0.0 | +0.0 | +0.0 | +0.0 | +0.0 | +0.0 | +0.0 | +0.0 | +0.0 | +0.0 | +0.0 | +0.0 | +0.0 | +0.0 | +0.0 |
| 3. |
Alabama (12) |
|
+0.0 | +0.0 | +0.0 | +0.0 | +0.0 | +0.0 | +0.0 | +0.0 | +0.0 | +0.0 | +0.0 | +0.0 | +0.0 | +0.0 | +0.0 | +0.0 |
| 4. |
Vanderbilt (13) |
|
+0.0 | +0.0 | +0.0 | +0.0 | +0.0 | +0.0 | +0.0 | +0.0 | +0.0 | +0.0 | +0.0 | +0.0 | +0.0 | +0.0 | +0.0 | +0.0 |
| 5. |
Tennessee (14) |
|
+0.0 | +0.0 | +0.0 | +0.0 | +0.0 | +0.0 | +0.0 | +0.0 | +0.0 | +0.0 | +0.0 | +0.0 | +0.0 | +0.0 | +0.0 | +0.0 |
| 6. |
Texas A&M (45) |
|
+0.0 | +0.0 | +0.0 | +0.0 | +0.0 | +0.0 | +0.0 | +0.0 | +0.0 | +0.0 | +0.0 | +0.0 | +0.0 | +0.0 | +0.0 | +0.0 |
| 7. |
Kentucky (29) |
|
+0.0 | +0.0 | +0.0 | +0.0 | +0.0 | +0.0 | +0.0 | +0.0 | +0.0 | +0.0 | +0.0 | +0.0 | +0.0 | +0.0 | +0.0 | +0.0 |
| 8. |
Georgia (33) |
|
+0.0 | +0.0 | +0.0 | +0.0 | +0.0 | +0.0 | +0.0 | +0.0 | +0.0 | +0.0 | +0.0 | +0.0 | +0.0 | +0.0 | +0.0 | +0.0 |
| 9. |
Missouri (58) |
|
+0.0 | +0.0 | +0.0 | +0.0 | +0.0 | +0.0 | +0.0 | +0.0 | +0.0 | +0.0 | +0.0 | +0.0 | +0.0 | +0.0 | +0.0 | +0.0 |
| 10. |
Texas (34) |
|
+0.0 | +0.0 | +0.0 | +0.0 | +0.0 | +0.0 | +0.0 | +0.0 | +0.0 | +0.0 | +0.0 | +0.0 | +0.0 | +0.0 | +0.0 | +0.0 |
| 11. |
Oklahoma (46) |
|
+0.0 | +0.0 | +0.0 | +0.0 | +0.0 | +0.0 | +0.0 | +0.0 | +0.0 | +0.0 | +0.0 | +0.0 | +0.0 | +0.0 | +0.0 | +0.0 |
| 12. |
Auburn (38) |
|
+0.0 | +0.0 | +0.0 | +0.0 | +0.0 | +0.0 | +0.0 | +0.0 | +0.0 | +0.0 | +0.0 | +0.0 | +0.0 | +0.0 | +0.0 | +0.0 |
| 13. |
Mississippi (80) |
|
+0.0 | +0.0 | +0.0 | +0.0 | +0.0 | +0.0 | +0.0 | +0.0 | +0.0 | +0.0 | +0.0 | +0.0 | +0.0 | +0.0 | +0.0 | +0.0 |
| 14. |
Mississippi St. (108) |
|
+0.0 | +0.0 | +0.0 | +0.0 | +0.0 | +0.0 | +0.0 | +0.0 | +0.0 | +0.0 | +0.0 | +0.0 | +0.0 | +0.0 | +0.0 | +0.0 |
| 15. |
South Carolina (100) |
|
+0.0 | +0.0 | +0.0 | +0.0 | +0.0 | +0.0 | +0.0 | +0.0 | +0.0 | +0.0 | +0.0 | +0.0 | +0.0 | +0.0 | +0.0 | +0.0 |
| 16. |
LSU (61) |
|
+0.0 | +0.0 | +0.0 | +0.0 | +0.0 | +0.0 | +0.0 | +0.0 | +0.0 | +0.0 | +0.0 | +0.0 | +0.0 | +0.0 | +0.0 | +0.0 |
This table gives the probability of earning at least a share of a given place.
So there are no tiebreakers and there can be multiple first place teams, for example.