Big East
Updated with games through Friday, March 27
Conference Projections
Based on 10,000 simulations of the remaining season.
Tiebreaking was done using the
Big Ten tiebreaking procedures.
| Big East |
Current Record |
Projected Record |
Projected Finish (% odds, with tiebreakers) |
|
Team |
Conf. |
Overall |
Conf. |
Overall |
1st | 2nd | 3rd | 4th | 5th | 6th | 7th | 8th | 9th | 10th | 11th |
| 1. |
St. John's (15) |
21 - 2 |
30 - 7 |
21.0 - 2.0 |
30.0 - 7.0 |
100.0 | | | | | | | | | | |
| 2. |
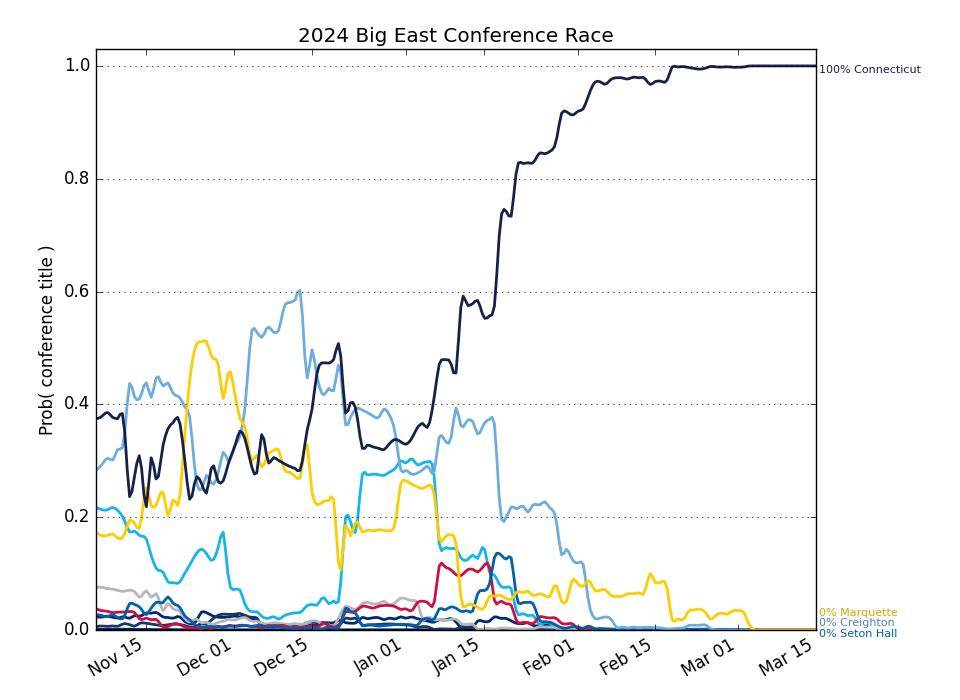
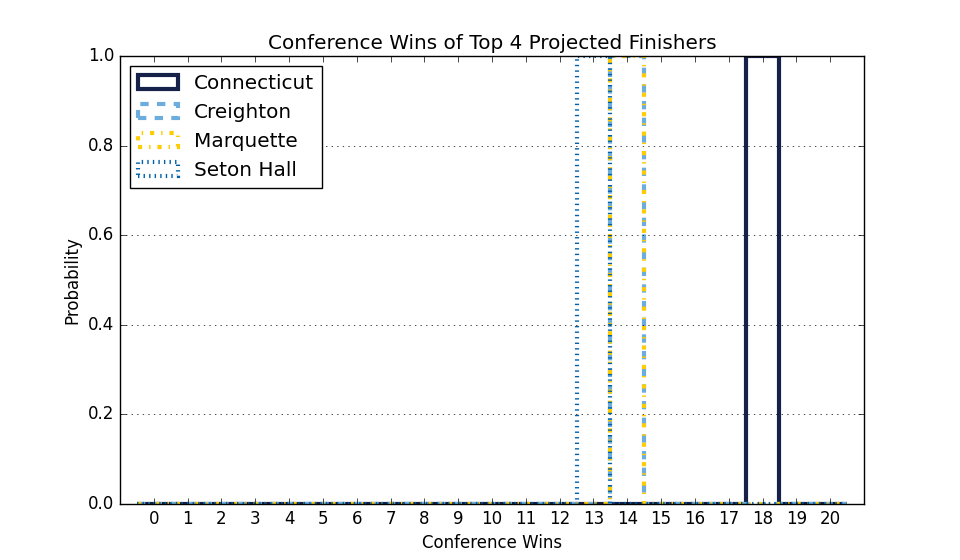
Connecticut (11) |
19 - 4 |
32 - 5 |
19.0 - 4.0 |
32.0 - 5.0 |
| 100.0 | | | | | | | | | |
| 3. |
Villanova (40) |
15 - 6 |
24 - 9 |
15.0 - 6.0 |
24.0 - 9.0 |
| | 100.0 | | | | | | | | |
| 4. |
Seton Hall (53) |
11 - 11 |
21 - 12 |
11.0 - 11.0 |
21.0 - 12.0 |
| | | 100.0 | | | | | | | |
| 5. |
Creighton (71) |
9 - 12 |
15 - 17 |
9.0 - 12.0 |
15.0 - 17.0 |
| | | | 100.0 | | | | | | |
| 6. |
DePaul (101) |
8 - 13 |
16 - 16 |
8.0 - 13.0 |
16.0 - 16.0 |
| | | | | 100.0 | | | | | |
| 7. |
Providence (64) |
8 - 14 |
15 - 18 |
8.0 - 14.0 |
15.0 - 18.0 |
| | | | | | 100.0 | | | | |
| 8. |
Georgetown (86) |
8 - 15 |
16 - 18 |
8.0 - 15.0 |
16.0 - 18.0 |
| | | | | | | 100.0 | | | |
| 9. |
Marquette (89) |
7 - 14 |
12 - 20 |
7.0 - 14.0 |
12.0 - 20.0 |
| | | | | | | | 100.0 | | |
| 10. |
Butler (70) |
7 - 14 |
16 - 16 |
7.0 - 14.0 |
16.0 - 16.0 |
| | | | | | | | | 100.0 | |
| 11. |
Xavier (97) |
7 - 15 |
15 - 18 |
7.0 - 15.0 |
15.0 - 18.0 |
| | | | | | | | | | 100.0 |
Weekly Changes |
| 1. |
St. John's (15) |
|
+0.0 | +0.0 | +0.0 | +0.0 | +0.0 | +0.0 | +0.0 | +0.0 | +0.0 | +0.0 | +0.0 |
| 2. |
Connecticut (11) |
|
+0.0 | +0.0 | +0.0 | +0.0 | +0.0 | +0.0 | +0.0 | +0.0 | +0.0 | +0.0 | +0.0 |
| 3. |
Villanova (40) |
|
+0.0 | +0.0 | +0.0 | +0.0 | +0.0 | +0.0 | +0.0 | +0.0 | +0.0 | +0.0 | +0.0 |
| 4. |
Seton Hall (53) |
|
+0.0 | +0.0 | +0.0 | +0.0 | +0.0 | +0.0 | +0.0 | +0.0 | +0.0 | +0.0 | +0.0 |
| 5. |
Creighton (71) |
|
+0.0 | +0.0 | +0.0 | +0.0 | +0.0 | +0.0 | +0.0 | +0.0 | +0.0 | +0.0 | +0.0 |
| 6. |
DePaul (101) |
|
+0.0 | +0.0 | +0.0 | +0.0 | +0.0 | +0.0 | +0.0 | +0.0 | +0.0 | +0.0 | +0.0 |
| 7. |
Providence (64) |
|
+0.0 | +0.0 | +0.0 | +0.0 | +0.0 | +0.0 | +0.0 | +0.0 | +0.0 | +0.0 | +0.0 |
| 8. |
Georgetown (86) |
|
+0.0 | +0.0 | +0.0 | +0.0 | +0.0 | +0.0 | +0.0 | +0.0 | +0.0 | +0.0 | +0.0 |
| 9. |
Marquette (89) |
|
+0.0 | +0.0 | +0.0 | +0.0 | +0.0 | +0.0 | +0.0 | +0.0 | +0.0 | +0.0 | +0.0 |
| 10. |
Butler (70) |
|
+0.0 | +0.0 | +0.0 | +0.0 | +0.0 | +0.0 | +0.0 | +0.0 | +0.0 | +0.0 | +0.0 |
| 11. |
Xavier (97) |
|
+0.0 | +0.0 | +0.0 | +0.0 | +0.0 | +0.0 | +0.0 | +0.0 | +0.0 | +0.0 | +0.0 |
This table gives the probability of earning at least a share of a given place.
So there are no tiebreakers and there can be multiple first place teams, for example.