32-5 (Overall)
Net: 30.8 (11th)
Off: 124.2 (27th)
Def: 93.4 (11th)
SoR: 96.6 (4th)
| Home | Game Probabilities | Conferences | Preseason Predictions | Odds Charts | NCAA Tournament |
| City: | Storrs, Connecticut | |
| Conference: | Big East (2nd)
| |
| Record: | 19-4 (Conf) 32-5 (Overall) | |
| Ratings: | Comp.: 30.8 (11th) Net: 30.8 (11th) Off: 124.2 (27th) Def: 93.4 (11th) SoR: 96.6 (4th) |
| Remaining | ||||||
|---|---|---|---|---|---|---|
| Date | Opponent | Win Prob | Pred. | |||
| 3/29 | (N) Duke (1) | 22.5% | L 66-74 | |||
| Previous | Game Score | |||||
| Date | Opponent | Win Prob | Result | Off | Def | Net |
| 11/3 | New Haven (321) | 99.5% | W 79-55 | -10.6 | -9.2 | -19.9 |
| 11/7 | UMass Lowell (324) | 99.5% | W 110-47 | 10.6 | 20.5 | 31.0 |
| 11/10 | Columbia (186) | 97.9% | W 89-62 | 6.9 | 2.2 | 9.0 |
| 11/15 | (N) BYU (21) | 58.2% | W 86-84 | 1.2 | -3.1 | -1.8 |
| 11/19 | Arizona (3) | 40.0% | L 67-71 | -1.1 | -2.8 | -3.9 |
| 11/23 | Bryant (355) | 99.8% | W 72-49 | -31.3 | 0.5 | -30.7 |
| 11/28 | (N) Illinois (4) | 32.5% | W 74-61 | 0.2 | 24.5 | 24.7 |
| 12/2 | @Kansas (23) | 43.6% | W 61-56 | -6.9 | 15.6 | 8.7 |
| 12/5 | Texas A&M Commerce (303) | 99.3% | W 83-59 | -3.5 | -10.0 | -13.6 |
| 12/9 | (N) Florida (5) | 34.3% | W 77-73 | 8.3 | 4.0 | 12.3 |
| 12/12 | Texas (34) | 80.7% | W 71-63 | -15.1 | 9.0 | -6.0 |
| 12/16 | Butler (70) | 91.2% | W 79-60 | -7.7 | 12.7 | 5.0 |
| 12/21 | @DePaul (101) | 84.4% | W 72-54 | -5.9 | 14.4 | 8.4 |
| 12/31 | @Xavier (97) | 83.2% | W 90-67 | 4.7 | 10.3 | 15.0 |
| 1/4 | Marquette (89) | 93.6% | W 73-57 | -9.7 | 10.6 | 0.9 |
| 1/7 | @Providence (64) | 74.0% | W 103-98 | 6.7 | -8.2 | -1.5 |
| 1/10 | DePaul (101) | 94.8% | W 72-60 | -6.1 | -6.0 | -12.1 |
| 1/13 | @Seton Hall (53) | 69.9% | W 69-64 | 0.2 | -3.2 | -3.1 |
| 1/17 | @Georgetown (86) | 79.6% | W 64-62 | -6.8 | -2.9 | -9.6 |
| 1/24 | Villanova (40) | 84.2% | W 75-67 | -1.0 | -3.4 | -4.4 |
| 1/27 | Providence (64) | 90.6% | W 87-81 | -6.5 | -12.5 | -19.0 |
| 1/31 | @Creighton (71) | 75.5% | W 85-58 | 28.0 | 5.4 | 33.4 |
| 2/3 | Xavier (97) | 94.4% | W 92-60 | 7.3 | 7.1 | 14.4 |
| 2/6 | @St. John's (15) | 37.6% | L 72-81 | 2.2 | -8.0 | -5.9 |
| 2/11 | @Butler (70) | 75.3% | W 80-70 | 19.3 | -9.5 | 9.7 |
| 2/14 | Georgetown (86) | 93.0% | W 79-75 | 1.2 | -19.1 | -17.9 |
| 2/18 | Creighton (71) | 91.3% | L 84-91 | -11.4 | -26.3 | -37.7 |
| 2/21 | @Villanova (40) | 61.0% | W 73-63 | 7.7 | 9.8 | 17.5 |
| 2/25 | St. John's (15) | 67.2% | W 72-40 | 9.3 | 31.7 | 41.0 |
| 2/28 | Seton Hall (53) | 88.8% | W 71-67 | 1.9 | -14.3 | -12.4 |
| 3/7 | @Marquette (89) | 81.0% | L 62-68 | -21.0 | -3.9 | -24.9 |
| 3/12 | (N) Xavier (97) | 90.1% | W 93-68 | 20.6 | -8.1 | 12.5 |
| 3/13 | (N) Georgetown (86) | 87.8% | W 67-51 | -7.0 | 12.2 | 5.1 |
| 3/14 | (N) St. John's (15) | 52.6% | L 52-72 | -22.9 | -6.6 | -29.5 |
| 3/20 | (N) Furman (195) | 96.3% | W 82-71 | 3.5 | -16.7 | -13.2 |
| 3/22 | (N) UCLA (30) | 67.2% | W 73-57 | 0.3 | 14.7 | 15.1 |
| 3/27 | (N) Michigan St. (10) | 49.5% | W 67-63 | -2.4 | 8.8 | 6.4 |
| Stats & Trends | |||||
|---|---|---|---|---|---|
| Current | Day | Week | Month | Season | |
| Composite | 30.8 | +0.2 | +0.7 | +0.2 | -1.6 |
| Comp Rank | 11 | -- | +1 | -- | -10 |
| Net Efficiency | 30.8 | +0.2 | +0.7 | +0.2 | -- |
| Net Rank | 11 | -- | +1 | -- | -- |
| Off Efficiency | 124.2 | +0.0 | +0.1 | +0.2 | -- |
| Off Rank | 27 | -- | +1 | -2 | -- |
| Def Efficiency | 93.4 | +0.2 | +0.6 | +0.0 | -- |
| Def Rank | 11 | +1 | +3 | -- | -- |
| SoS Rank | 29 | +4 | +7 | +1 | -- |
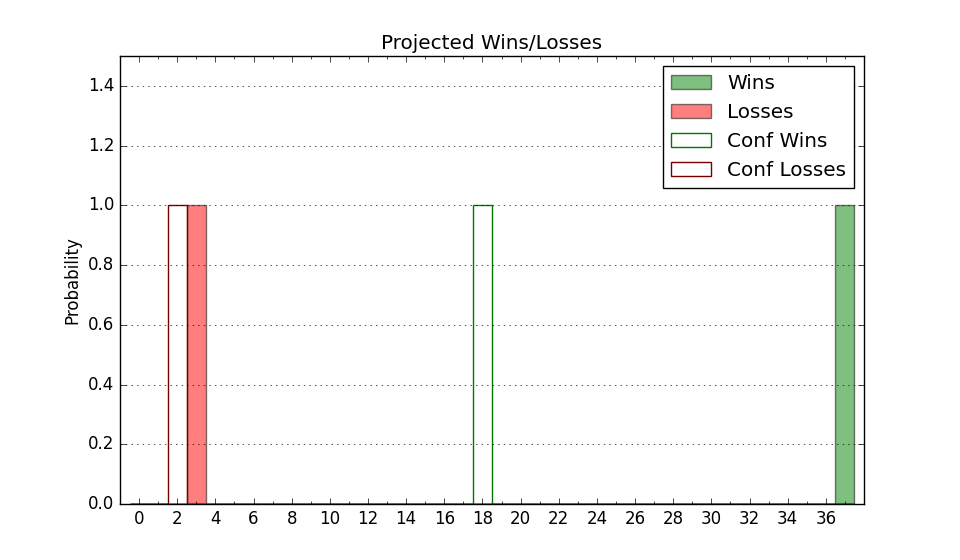
| Exp. Wins | 32.0 | +1.0 | +2.0 | +4.6 | +6.6 |
| Exp. Conf Wins | 19.0 | -- | -- | +1.6 | +2.6 |
| Conf Champ Prob | 0.0 | -- | -- | -64.4 | -63.9 |
| Advanced Stats | ||
|---|---|---|
| Stat | Value | Rank |
| Off Eff FG % | 0.588 | 16 |
| Off Ast Ratio | 0.208 | 2 |
| Off ORB% | 0.389 | 17 |
| Off TO Rate | 0.138 | 122 |
| Off FT Ratio | 0.347 | 195 |
| Def Eff FG % | 0.436 | 8 |
| Def Ast Ratio | 0.111 | 5 |
| Def ORB% | 0.251 | 25 |
| Def TO Rate | 0.173 | 33 |
| Def FT Ratio | 0.383 | 261 |