12-18 (Overall)
Net: -17.5 (324th)
Off: 101.3 (302nd)
Def: 118.8 (328th)
SoR: 0.0 (97th)
| Home | Game Probabilities | Conferences | Preseason Predictions | Odds Charts | NCAA Tournament |
| City: | Lowell, Massachusetts | |
| Conference: | America East (4th)
| |
| Record: | 10-8 (Conf) 12-18 (Overall) | |
| Ratings: | Comp.: -17.5 (324th) Net: -17.5 (324th) Off: 101.3 (302nd) Def: 118.8 (328th) SoR: 0.0 (97th) |
| Remaining | ||||||
|---|---|---|---|---|---|---|
| Date | Opponent | Win Prob | Pred. | |||
| Previous | Game Score | |||||
| Date | Opponent | Win Prob | Result | Off | Def | Net |
| 11/7 | @Connecticut (11) | 0.5% | L 47-110 | -20.5 | -10.6 | -31.0 |
| 11/10 | New Haven (321) | 64.2% | L 67-73 | -11.9 | -4.5 | -16.5 |
| 11/13 | @Columbia (186) | 10.3% | L 72-86 | 1.8 | 7.3 | 9.1 |
| 11/16 | @Wake Forest (65) | 2.4% | L 75-109 | 7.0 | -13.6 | -6.6 |
| 11/19 | @Bradley (119) | 5.6% | L 77-87 | 19.4 | -9.8 | 9.5 |
| 11/22 | @Saint Peter's (256) | 18.4% | L 66-68 | -9.6 | 21.4 | 11.7 |
| 11/26 | @Stonehill (325) | 35.7% | W 75-64 | 11.8 | 10.3 | 22.1 |
| 12/6 | @Massachusetts (212) | 12.7% | L 60-80 | -19.5 | 16.9 | -2.6 |
| 12/13 | @Quinnipiac (231) | 15.0% | L 71-75 | -4.9 | 13.2 | 8.3 |
| 12/16 | Sacred Heart (308) | 57.3% | W 87-82 | 3.8 | -0.2 | 3.6 |
| 12/21 | @Boston University (269) | 20.3% | L 76-88 | 6.5 | -14.1 | -7.6 |
| 12/29 | @Iowa (20) | 0.6% | L 62-90 | 7.5 | -0.2 | 7.2 |
| 1/3 | Albany (329) | 66.8% | W 83-71 | 11.5 | 3.3 | 14.8 |
| 1/8 | @Bryant (355) | 53.2% | W 77-63 | 9.1 | 7.1 | 16.2 |
| 1/10 | @Binghamton (361) | 64.9% | W 73-68 | -5.9 | 10.3 | 4.4 |
| 1/15 | NJIT (331) | 68.7% | L 64-73 | -18.6 | -1.4 | -20.0 |
| 1/22 | Vermont (244) | 41.0% | L 68-77 | -8.5 | -3.0 | -11.5 |
| 1/24 | @UMBC (209) | 12.4% | L 56-79 | -14.2 | 1.9 | -12.3 |
| 1/29 | @New Hampshire (343) | 45.8% | L 61-66 | -15.7 | 12.5 | -3.2 |
| 1/31 | Maine (336) | 70.9% | W 91-77 | 23.7 | -9.9 | 13.8 |
| 2/5 | @NJIT (331) | 39.2% | L 56-81 | -21.9 | -13.1 | -35.0 |
| 2/7 | @Albany (329) | 37.1% | W 89-79 | 20.6 | -1.1 | 19.6 |
| 2/12 | Bryant (355) | 79.5% | W 88-69 | 21.1 | -5.8 | 15.3 |
| 2/19 | New Hampshire (343) | 74.2% | W 78-56 | -0.5 | 21.5 | 21.1 |
| 2/21 | Binghamton (361) | 86.3% | W 92-79 | 27.2 | -17.9 | 9.3 |
| 2/26 | @Vermont (244) | 16.9% | L 64-66 | -4.1 | 15.9 | 11.8 |
| 2/28 | UMBC (209) | 32.6% | L 60-84 | -15.4 | -17.2 | -32.7 |
| 3/3 | @Maine (336) | 41.7% | W 67-56 | 1.7 | 17.5 | 19.2 |
| 3/7 | Albany (329) | 66.8% | W 81-76 | 4.0 | -6.7 | -2.6 |
| 3/10 | @UMBC (209) | 12.4% | L 69-91 | -0.1 | -18.4 | -18.5 |
| Stats & Trends | |||||
|---|---|---|---|---|---|
| Current | Day | Week | Month | Season | |
| Composite | -17.5 | +0.0 | +0.0 | -0.9 | -1.4 |
| Comp Rank | 324 | -- | -- | -5 | +3 |
| Net Efficiency | -17.5 | +0.0 | +0.0 | -0.8 | -- |
| Net Rank | 324 | -- | -- | -5 | -- |
| Off Efficiency | 101.3 | +0.0 | +0.0 | -0.5 | -- |
| Off Rank | 302 | -- | -- | -10 | -- |
| Def Efficiency | 118.8 | +0.0 | +0.0 | -0.3 | -- |
| Def Rank | 328 | -- | -- | -3 | -- |
| SoS Rank | 327 | -- | -3 | +3 | -- |
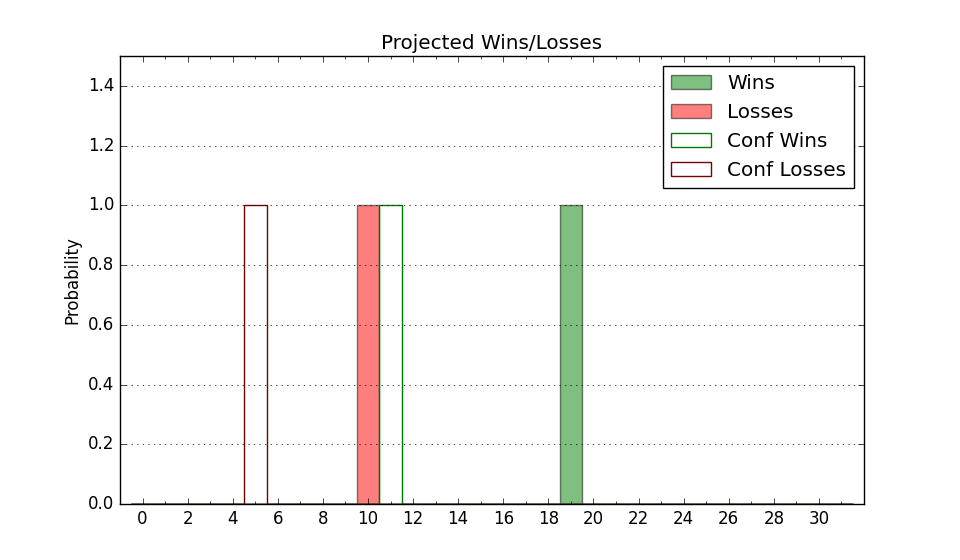
| Exp. Wins | 12.0 | -- | -- | +0.9 | +1.8 |
| Exp. Conf Wins | 10.0 | -- | -- | +0.9 | +2.6 |
| Conf Champ Prob | 0.0 | -- | -- | -0.1 | -8.7 |
| Advanced Stats | ||
|---|---|---|
| Stat | Value | Rank |
| Off Eff FG % | 0.485 | 269 |
| Off Ast Ratio | 0.127 | 302 |
| Off ORB% | 0.309 | 161 |
| Off TO Rate | 0.172 | 336 |
| Off FT Ratio | 0.340 | 218 |
| Def Eff FG % | 0.551 | 307 |
| Def Ast Ratio | 0.157 | 257 |
| Def ORB% | 0.326 | 277 |
| Def TO Rate | 0.111 | 356 |
| Def FT Ratio | 0.304 | 74 |