14-17 (Overall)
Net: -0.6 (170th)
Off: 105.8 (229th)
Def: 106.4 (121st)
SoR: 0.0 (97th)
| Home | Game Probabilities | Conferences | Preseason Predictions | Odds Charts | NCAA Tournament |
| City: | Los Angeles, California | |
| Conference: | West Coast (10th)
| |
| Record: | 6-13 (Conf) 14-17 (Overall) | |
| Ratings: | Comp.: -0.6 (170th) Net: -0.6 (170th) Off: 105.8 (229th) Def: 106.4 (121st) SoR: 0.0 (97th) |
| Remaining | ||||||
|---|---|---|---|---|---|---|
| Date | Opponent | Win Prob | Pred. | |||
| Previous | Game Score | |||||
| Date | Opponent | Win Prob | Result | Off | Def | Net |
| 11/5 | Eastern Washington (177) | 65.9% | W 70-62 | -14.1 | 17.2 | 3.2 |
| 11/8 | Arkansas Pine Bluff (322) | 90.6% | W 94-72 | 17.0 | -7.4 | 9.6 |
| 11/11 | @UTEP (267) | 56.9% | W 71-58 | 10.3 | 9.4 | 19.7 |
| 11/14 | Troy (145) | 58.9% | W 74-63 | -1.3 | 13.6 | 12.3 |
| 11/17 | @UC Santa Barbara (141) | 28.9% | W 78-74 | 2.5 | 13.2 | 15.6 |
| 11/24 | (N) Florida Atlantic (127) | 38.4% | L 65-76 | -3.1 | -12.8 | -16.0 |
| 11/25 | (N) Ohio (238) | 65.5% | W 70-58 | -13.5 | 23.0 | 9.5 |
| 11/28 | Stony Brook (241) | 78.2% | L 68-71 | -12.5 | -8.0 | -20.6 |
| 12/2 | Saint Louis (32) | 15.3% | L 70-91 | -7.8 | -2.2 | -10.0 |
| 12/16 | UC San Diego (131) | 54.5% | L 57-67 | -22.1 | 6.0 | -16.1 |
| 12/19 | North Alabama (340) | 93.1% | W 91-57 | 15.5 | 10.4 | 25.9 |
| 12/23 | Morgan St. (357) | 96.2% | W 83-56 | -0.9 | 12.0 | 11.0 |
| 12/28 | Saint Mary's (24) | 11.8% | L 73-78 | 27.8 | -17.7 | 10.1 |
| 12/30 | Pacific (106) | 46.4% | W 80-71 | 11.7 | 1.7 | 13.4 |
| 1/2 | @Washington St. (129) | 25.5% | L 76-78 | 3.1 | -0.1 | 3.0 |
| 1/4 | @Gonzaga (9) | 1.9% | L 47-82 | -15.7 | 3.8 | -11.9 |
| 1/8 | San Francisco (112) | 48.8% | W 84-82 | -2.4 | 4.2 | 1.8 |
| 1/10 | @Santa Clara (42) | 6.8% | L 72-103 | -1.9 | -11.7 | -13.6 |
| 1/14 | @Oregon St. (165) | 34.2% | L 70-76 | -3.2 | -0.9 | -4.1 |
| 1/17 | Portland (210) | 72.0% | L 58-71 | -26.2 | -5.2 | -31.3 |
| 1/21 | @Seattle (113) | 21.9% | L 59-69 | -4.9 | 1.0 | -3.9 |
| 1/28 | Oregon St. (165) | 63.9% | L 69-72 | -3.0 | -5.2 | -8.2 |
| 1/31 | Santa Clara (42) | 19.8% | L 73-104 | -8.8 | -20.2 | -29.0 |
| 2/4 | @San Francisco (112) | 21.8% | W 84-75 | 20.0 | 1.4 | 21.4 |
| 2/7 | San Diego (226) | 74.7% | W 83-63 | 20.7 | 1.5 | 22.1 |
| 2/11 | @Pacific (106) | 20.3% | L 59-65 | -5.4 | 5.8 | 0.4 |
| 2/14 | @Pepperdine (261) | 55.5% | L 89-90 | 21.4 | -22.9 | -1.5 |
| 2/21 | @San Diego (226) | 46.5% | W 77-65 | 17.2 | 0.9 | 18.1 |
| 2/25 | Washington St. (129) | 53.8% | W 67-66 | -11.2 | 11.4 | 0.2 |
| 2/28 | Seattle (113) | 48.8% | L 66-71 | 9.1 | -17.7 | -8.6 |
| 3/5 | (N) San Diego (226) | 61.6% | L 62-66 | -6.5 | -2.7 | -9.3 |
| Stats & Trends | |||||
|---|---|---|---|---|---|
| Current | Day | Week | Month | Season | |
| Composite | -0.6 | -0.0 | -0.0 | -1.0 | -1.7 |
| Comp Rank | 170 | -- | -- | -12 | -52 |
| Net Efficiency | -0.6 | -0.0 | -0.0 | -1.0 | -- |
| Net Rank | 170 | -- | -- | -12 | -- |
| Off Efficiency | 105.8 | -0.0 | -0.0 | -0.5 | -- |
| Off Rank | 229 | -- | -2 | -8 | -- |
| Def Efficiency | 106.4 | -0.0 | +0.0 | -0.5 | -- |
| Def Rank | 121 | -- | -- | -5 | -- |
| SoS Rank | 143 | -- | -1 | -14 | -- |
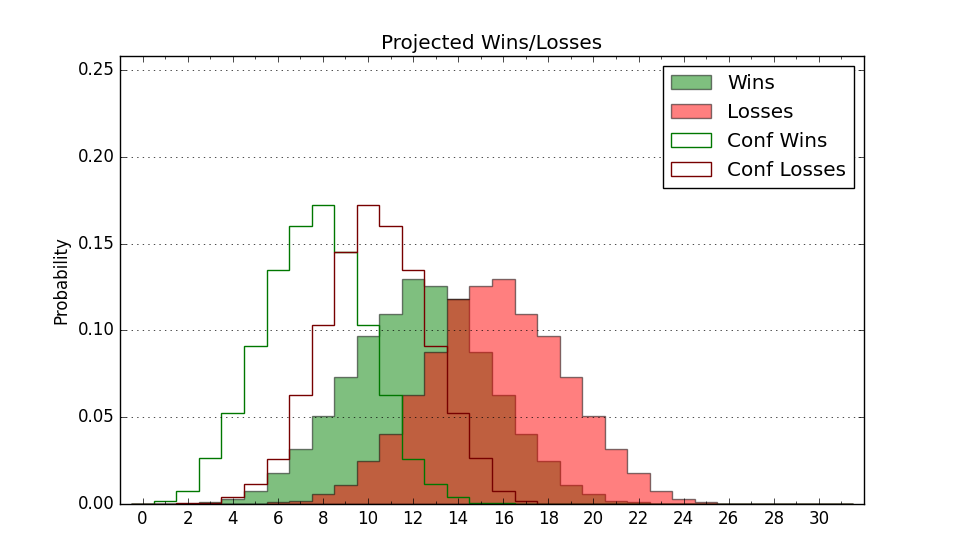
| Exp. Wins | 14.0 | -- | -- | -0.0 | -2.1 |
| Exp. Conf Wins | 6.0 | -- | -- | -0.0 | -2.1 |
| Conf Champ Prob | 0.0 | -- | -- | -- | -0.6 |
| Advanced Stats | ||
|---|---|---|
| Stat | Value | Rank |
| Off Eff FG % | 0.528 | 124 |
| Off Ast Ratio | 0.144 | 200 |
| Off ORB% | 0.267 | 280 |
| Off TO Rate | 0.153 | 247 |
| Off FT Ratio | 0.307 | 285 |
| Def Eff FG % | 0.476 | 48 |
| Def Ast Ratio | 0.133 | 64 |
| Def ORB% | 0.315 | 238 |
| Def TO Rate | 0.138 | 228 |
| Def FT Ratio | 0.337 | 158 |