15-16 (Overall)
Net: -0.2 (166th)
Off: 111.6 (131st)
Def: 111.7 (223rd)
SoR: 0.0 (97th)
| Home | Game Probabilities | Conferences | Preseason Predictions | Odds Charts | NCAA Tournament |
| City: | Philadelphia, Pennsylvania | |
| Conference: | American (9th)
| |
| Record: | 8-11 (Conf) 15-16 (Overall) | |
| Ratings: | Comp.: -0.2 (166th) Net: -0.2 (166th) Off: 111.6 (131st) Def: 111.7 (223rd) SoR: 0.0 (97th) |
| Remaining | ||||||
|---|---|---|---|---|---|---|
| Date | Opponent | Win Prob | Pred. | |||
| Previous | Game Score | |||||
| Date | Opponent | Win Prob | Result | Off | Def | Net |
| 11/5 | Delaware St. (362) | 97.4% | W 83-65 | 9.0 | -12.6 | -3.6 |
| 11/11 | La Salle (248) | 79.6% | W 90-63 | 11.4 | 11.2 | 22.6 |
| 11/15 | Boston College (148) | 60.7% | L 71-76 | -12.0 | -3.1 | -15.1 |
| 11/19 | Hofstra (93) | 41.7% | W 81-76 | 8.1 | 2.7 | 10.8 |
| 11/24 | (N) UC San Diego (131) | 40.3% | L 76-91 | 2.1 | -22.6 | -20.4 |
| 11/25 | (N) Princeton (252) | 68.5% | W 79-75 | 5.2 | -7.0 | -1.8 |
| 11/26 | (N) Rhode Island (153) | 46.4% | L 75-90 | 3.1 | -22.4 | -19.3 |
| 12/1 | @Villanova (40) | 6.8% | L 56-74 | -3.2 | -4.4 | -7.6 |
| 12/6 | Saint Joseph's (128) | 54.5% | L 69-70 | -0.0 | -7.6 | -7.6 |
| 12/14 | St. Francis PA (354) | 95.5% | W 95-67 | 8.9 | 0.0 | 8.9 |
| 12/18 | @Davidson (120) | 24.7% | W 68-63 | 5.9 | 12.0 | 17.9 |
| 12/22 | Princeton (252) | 80.0% | W 65-61 | -6.6 | 1.9 | -4.7 |
| 12/30 | @Charlotte (182) | 37.9% | W 76-73 | -2.4 | 6.5 | 4.1 |
| 1/3 | UTSA (344) | 94.1% | W 76-57 | -6.2 | 11.5 | 5.2 |
| 1/7 | East Carolina (265) | 82.1% | W 75-67 | -2.6 | -4.1 | -6.8 |
| 1/14 | @Memphis (137) | 28.2% | L 53-55 | -18.6 | 29.2 | 10.6 |
| 1/18 | Florida Atlantic (127) | 54.5% | L 73-79 | -15.6 | 10.5 | -5.2 |
| 1/21 | @Rice (247) | 53.3% | W 69-65 | 0.5 | 5.9 | 6.3 |
| 1/24 | @UTSA (344) | 82.3% | W 70-64 | -3.2 | 2.2 | -1.0 |
| 1/28 | Charlotte (182) | 67.5% | L 76-80 | 14.4 | -27.5 | -13.1 |
| 1/31 | South Florida (51) | 24.7% | W 79-78 | 6.8 | 9.3 | 16.1 |
| 2/7 | @East Carolina (265) | 57.4% | W 81-73 | 17.9 | -8.1 | 9.9 |
| 2/11 | @Tulane (219) | 46.3% | L 66-77 | -14.2 | -4.4 | -18.6 |
| 2/15 | North Texas (144) | 59.6% | L 62-65 | -9.0 | -0.8 | -9.8 |
| 2/18 | UAB (123) | 53.5% | L 71-76 | -2.2 | -6.8 | -9.1 |
| 2/21 | @Wichita St. (75) | 13.0% | L 57-69 | -5.6 | 5.7 | 0.1 |
| 2/26 | @Florida Atlantic (127) | 26.0% | L 73-77 | 12.5 | -2.6 | 9.9 |
| 3/1 | Rice (247) | 79.6% | L 74-80 | -3.2 | -16.3 | -19.5 |
| 3/5 | Tulane (219) | 74.6% | W 89-60 | 13.4 | 15.3 | 28.7 |
| 3/8 | @Tulsa (57) | 10.4% | L 76-78 | 6.9 | 8.4 | 15.3 |
| 3/11 | (N) Florida Atlantic (127) | 39.3% | L 59-63 | -19.2 | 11.7 | -7.4 |
| Stats & Trends | |||||
|---|---|---|---|---|---|
| Current | Day | Week | Month | Season | |
| Composite | -0.2 | +0.0 | +0.2 | +1.3 | -1.0 |
| Comp Rank | 166 | -- | +3 | +24 | -45 |
| Net Efficiency | -0.2 | +0.0 | +0.2 | +1.3 | -- |
| Net Rank | 166 | -- | +3 | +24 | -- |
| Off Efficiency | 111.6 | +0.0 | +0.1 | +0.5 | -- |
| Off Rank | 131 | -- | +1 | +11 | -- |
| Def Efficiency | 111.7 | -0.0 | +0.1 | +0.8 | -- |
| Def Rank | 223 | -- | -- | +16 | -- |
| SoS Rank | 210 | -- | +4 | +17 | -- |
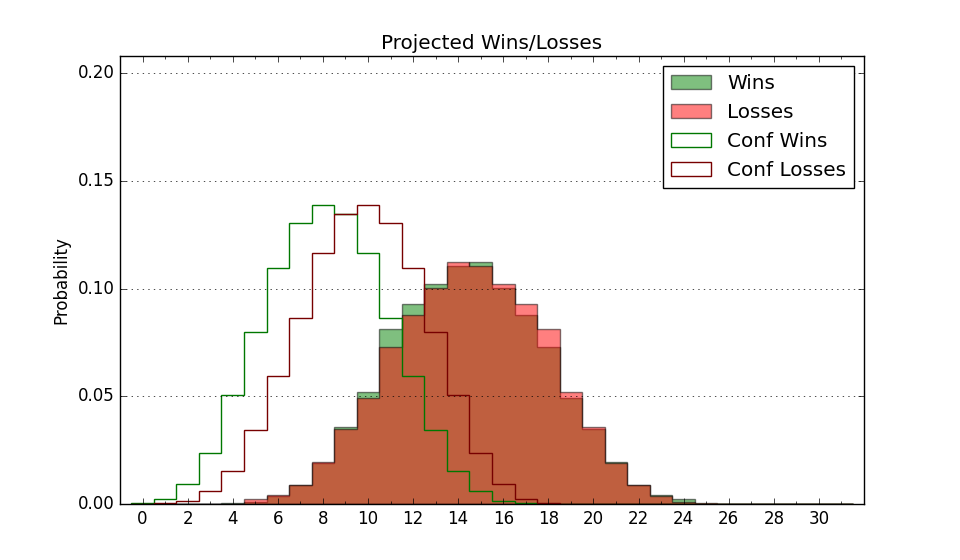
| Exp. Wins | 15.0 | -- | -- | -1.0 | -3.8 |
| Exp. Conf Wins | 8.0 | -- | -- | -1.0 | -2.5 |
| Conf Champ Prob | 0.0 | -- | -- | -- | -10.8 |
| Advanced Stats | ||
|---|---|---|
| Stat | Value | Rank |
| Off Eff FG % | 0.506 | 203 |
| Off Ast Ratio | 0.138 | 233 |
| Off ORB% | 0.290 | 213 |
| Off TO Rate | 0.121 | 29 |
| Off FT Ratio | 0.415 | 37 |
| Def Eff FG % | 0.521 | 203 |
| Def Ast Ratio | 0.149 | 194 |
| Def ORB% | 0.288 | 122 |
| Def TO Rate | 0.136 | 250 |
| Def FT Ratio | 0.349 | 179 |