19-11 (Overall)
Net: -4.1 (211th)
Off: 100.8 (308th)
Def: 105.0 (101st)
SoR: 0.0 (97th)
| Home | Game Probabilities | Conferences | Preseason Predictions | Odds Charts | NCAA Tournament |
| City: | Martin, Tennessee | |
| Conference: | Ohio Valley (4th)
| |
| Record: | 14-8 (Conf) 19-11 (Overall) | |
| Ratings: | Comp.: -4.1 (211th) Net: -4.1 (211th) Off: 100.8 (308th) Def: 105.0 (101st) SoR: 0.0 (97th) |
| Remaining | ||||||
|---|---|---|---|---|---|---|
| Date | Opponent | Win Prob | Pred. | |||
| Previous | Game Score | |||||
| Date | Opponent | Win Prob | Result | Off | Def | Net |
| 11/4 | @UNLV (104) | 15.1% | W 86-81 | 6.7 | 13.3 | 20.0 |
| 11/12 | @Bradley (119) | 18.0% | W 78-67 | 11.6 | 16.0 | 27.6 |
| 11/18 | @Florida St. (63) | 8.2% | L 73-87 | 3.1 | -1.9 | 1.2 |
| 11/22 | (N) Prairie View A&M (309) | 74.2% | W 69-68 | -3.8 | 2.2 | -1.6 |
| 11/23 | (N) Southern Miss (220) | 52.0% | L 60-70 | 7.9 | -32.3 | -24.4 |
| 12/2 | Charleston Southern (234) | 69.7% | W 73-56 | 3.9 | 11.1 | 14.9 |
| 12/7 | Alabama St. (316) | 85.5% | W 74-64 | 2.4 | -7.9 | -5.5 |
| 12/10 | @Southern Illinois (115) | 16.6% | L 54-83 | -9.8 | -15.8 | -25.6 |
| 12/18 | @Tennessee St. (199) | 32.8% | L 71-78 | 1.7 | -4.2 | -2.5 |
| 12/20 | @Tennessee Tech (313) | 62.6% | W 86-62 | 31.3 | 2.7 | 33.9 |
| 1/1 | Western Illinois (363) | 96.3% | W 67-60 | -11.2 | -9.0 | -20.1 |
| 1/3 | Eastern Illinois (314) | 85.3% | W 65-61 | -9.0 | -3.3 | -12.3 |
| 1/8 | @Morehead St. (282) | 52.8% | W 76-68 | 16.8 | -7.8 | 9.0 |
| 1/10 | @Southern Indiana (338) | 73.2% | W 73-56 | 16.8 | 2.5 | 19.2 |
| 1/15 | SIU Edwardsville (263) | 75.4% | W 65-59 | 5.6 | -0.1 | 5.5 |
| 1/17 | Lindenwood (260) | 74.9% | W 69-55 | -6.7 | 14.3 | 7.6 |
| 1/20 | @Southeast Missouri St. (239) | 42.3% | L 50-66 | -19.8 | -2.5 | -22.3 |
| 1/29 | @Eastern Illinois (314) | 63.1% | W 76-68 | 13.2 | -6.7 | 6.5 |
| 1/31 | @Western Illinois (363) | 88.5% | W 84-44 | 20.4 | 23.5 | 43.8 |
| 2/3 | Little Rock (311) | 84.6% | W 55-52 | -22.0 | 10.9 | -11.1 |
| 2/5 | Southern Indiana (338) | 90.3% | W 76-54 | 12.1 | 3.4 | 15.6 |
| 2/7 | Morehead St. (282) | 79.2% | L 55-61 | -19.0 | -3.2 | -22.1 |
| 2/12 | @Lindenwood (260) | 46.8% | L 74-75 | 10.5 | -9.2 | 1.3 |
| 2/14 | @SIU Edwardsville (263) | 47.4% | W 81-76 | 26.8 | -15.7 | 11.1 |
| 2/17 | Southeast Missouri St. (239) | 71.4% | L 53-56 | -30.7 | 14.7 | -16.0 |
| 2/19 | @Little Rock (311) | 61.7% | L 65-67 | 7.9 | -9.4 | -1.6 |
| 2/26 | Tennessee Tech (313) | 85.1% | W 64-49 | -14.7 | 18.9 | 4.2 |
| 2/28 | Tennessee St. (199) | 62.4% | L 42-67 | -41.5 | 0.2 | -41.3 |
| 3/5 | (N) Eastern Illinois (314) | 75.9% | W 66-63 | 4.6 | -10.0 | -5.4 |
| 3/6 | (N) Tennessee St. (199) | 47.3% | L 55-68 | -13.1 | -8.1 | -21.2 |
| Stats & Trends | |||||
|---|---|---|---|---|---|
| Current | Day | Week | Month | Season | |
| Composite | -4.1 | -0.0 | +0.0 | -2.0 | +13.0 |
| Comp Rank | 211 | -- | -- | -15 | +124 |
| Net Efficiency | -4.1 | -0.0 | +0.0 | -2.0 | -- |
| Net Rank | 211 | -- | -- | -16 | -- |
| Off Efficiency | 100.8 | -0.0 | +0.0 | -2.3 | -- |
| Off Rank | 308 | -- | -- | -35 | -- |
| Def Efficiency | 105.0 | -0.0 | -0.0 | +0.2 | -- |
| Def Rank | 101 | -- | +2 | +4 | -- |
| SoS Rank | 344 | -- | +1 | +2 | -- |
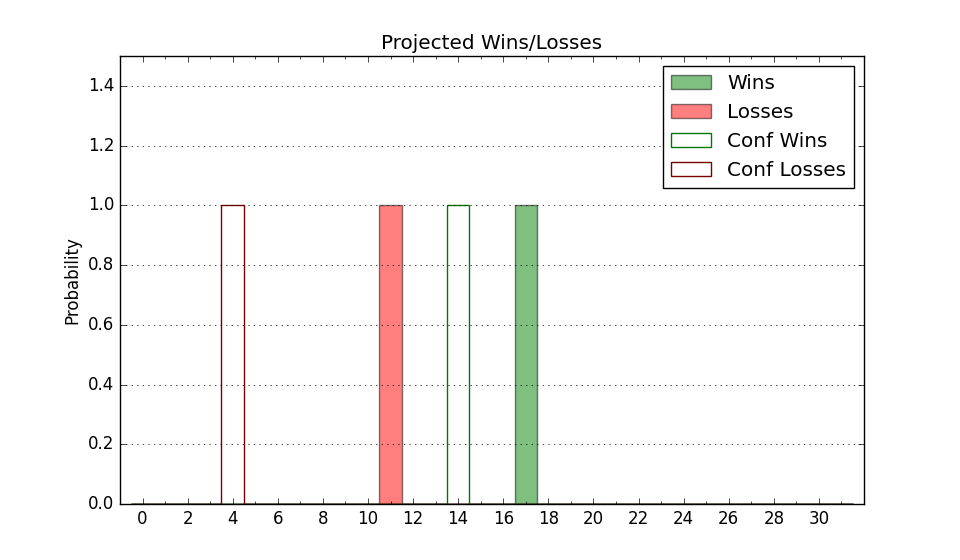
| Exp. Wins | 19.0 | -- | -- | +0.4 | +7.9 |
| Exp. Conf Wins | 14.0 | -- | -- | +0.4 | +5.4 |
| Conf Champ Prob | 0.0 | -- | -- | -16.4 | -3.0 |
| Advanced Stats | ||
|---|---|---|
| Stat | Value | Rank |
| Off Eff FG % | 0.473 | 313 |
| Off Ast Ratio | 0.136 | 246 |
| Off ORB% | 0.344 | 68 |
| Off TO Rate | 0.179 | 348 |
| Off FT Ratio | 0.342 | 213 |
| Def Eff FG % | 0.497 | 117 |
| Def Ast Ratio | 0.157 | 249 |
| Def ORB% | 0.333 | 295 |
| Def TO Rate | 0.163 | 64 |
| Def FT Ratio | 0.372 | 234 |