2-28 (Overall)
Net: -28.9 (360th)
Off: 94.4 (355th)
Def: 123.3 (354th)
SoR: 0.0 (97th)
| Home | Game Probabilities | Conferences | Preseason Predictions | Odds Charts | NCAA Tournament |
| City: | Boiling Springs, North Carolina | |
| Conference: | Big South (9th)
| |
| Record: | 2-16 (Conf) 2-28 (Overall) | |
| Ratings: | Comp.: -28.9 (360th) Net: -28.9 (360th) Off: 94.4 (355th) Def: 123.3 (354th) SoR: 0.0 (97th) |
| Remaining | ||||||
|---|---|---|---|---|---|---|
| Date | Opponent | Win Prob | Pred. | |||
| Previous | Game Score | |||||
| Date | Opponent | Win Prob | Result | Off | Def | Net |
| 11/3 | @Minnesota (66) | 0.8% | L 60-87 | -3.9 | 9.6 | 5.6 |
| 11/7 | @Clemson (39) | 0.4% | L 59-97 | 6.9 | -1.4 | 5.5 |
| 11/15 | @Elon (224) | 5.0% | L 84-95 | 10.1 | -1.8 | 8.2 |
| 11/18 | @DePaul (101) | 1.5% | L 62-93 | -2.0 | 8.3 | 6.3 |
| 11/22 | @Richmond (152) | 2.7% | L 67-102 | -1.4 | -2.4 | -3.8 |
| 11/26 | (N) Navy (147) | 4.6% | L 51-84 | -13.8 | -6.0 | -19.8 |
| 11/28 | (N) Southeastern Louisiana (281) | 15.2% | L 68-76 | -0.2 | 4.9 | 4.7 |
| 11/29 | @UNC Wilmington (107) | 1.6% | L 62-88 | 0.3 | 1.5 | 1.8 |
| 12/3 | @Queens (197) | 3.9% | L 74-107 | 4.5 | -11.2 | -6.8 |
| 12/6 | Georgia Southern (225) | 15.1% | L 84-88 | 9.3 | 1.1 | 10.5 |
| 12/15 | Wofford (253) | 19.2% | L 57-83 | -23.2 | -2.6 | -25.8 |
| 12/21 | @Tennessee (14) | 0.2% | L 52-94 | -0.1 | 6.7 | 6.5 |
| 12/31 | Charleston Southern (234) | 16.6% | L 79-89 | 8.8 | -6.1 | 2.7 |
| 1/3 | @Winthrop (133) | 2.1% | L 77-88 | 22.8 | -3.0 | 19.8 |
| 1/7 | @High Point (84) | 1.0% | L 49-104 | -28.0 | 0.7 | -27.3 |
| 1/14 | Radford (246) | 18.6% | L 80-89 | 13.5 | -10.9 | 2.6 |
| 1/17 | Presbyterian (245) | 18.5% | L 55-92 | -19.7 | -17.4 | -37.1 |
| 1/21 | @Longwood (259) | 7.0% | L 56-91 | -14.7 | -12.0 | -26.7 |
| 1/23 | USC Upstate (287) | 26.3% | W 67-65 | 2.3 | 11.2 | 13.4 |
| 1/29 | @UNC Asheville (229) | 5.3% | L 50-69 | -9.7 | 3.5 | -6.1 |
| 2/4 | Longwood (259) | 20.3% | L 66-86 | -6.0 | -7.1 | -13.1 |
| 2/7 | @Presbyterian (245) | 6.3% | L 62-68 | 4.6 | 11.4 | 15.9 |
| 2/12 | Winthrop (133) | 6.9% | L 85-103 | 12.2 | -14.6 | -2.4 |
| 2/14 | High Point (84) | 3.4% | L 87-112 | 20.3 | -13.4 | 6.9 |
| 2/17 | @Charleston Southern (234) | 5.5% | L 66-75 | -4.6 | 21.0 | 16.5 |
| 2/19 | @Radford (246) | 6.3% | L 70-82 | 7.2 | 3.3 | 10.5 |
| 2/26 | UNC Asheville (229) | 16.1% | L 71-77 | 15.6 | -11.3 | 4.2 |
| 2/28 | @USC Upstate (287) | 9.5% | L 61-71 | -7.0 | 14.0 | 7.0 |
| 3/4 | (N) USC Upstate (287) | 16.2% | W 65-64 | 6.9 | 15.0 | 21.9 |
| 3/6 | (N) High Point (84) | 1.9% | L 59-81 | -5.7 | 17.3 | 11.5 |
| Stats & Trends | |||||
|---|---|---|---|---|---|
| Current | Day | Week | Month | Season | |
| Composite | -28.9 | +0.0 | -0.0 | +1.6 | -18.3 |
| Comp Rank | 360 | -- | -- | +2 | -92 |
| Net Efficiency | -28.9 | +0.0 | -0.0 | +1.7 | -- |
| Net Rank | 360 | -- | -- | +2 | -- |
| Off Efficiency | 94.4 | +0.0 | -0.0 | +0.5 | -- |
| Off Rank | 355 | -- | -- | -- | -- |
| Def Efficiency | 123.3 | +0.0 | +0.0 | +1.2 | -- |
| Def Rank | 354 | -- | -- | +4 | -- |
| SoS Rank | 156 | +1 | -- | -7 | -- |
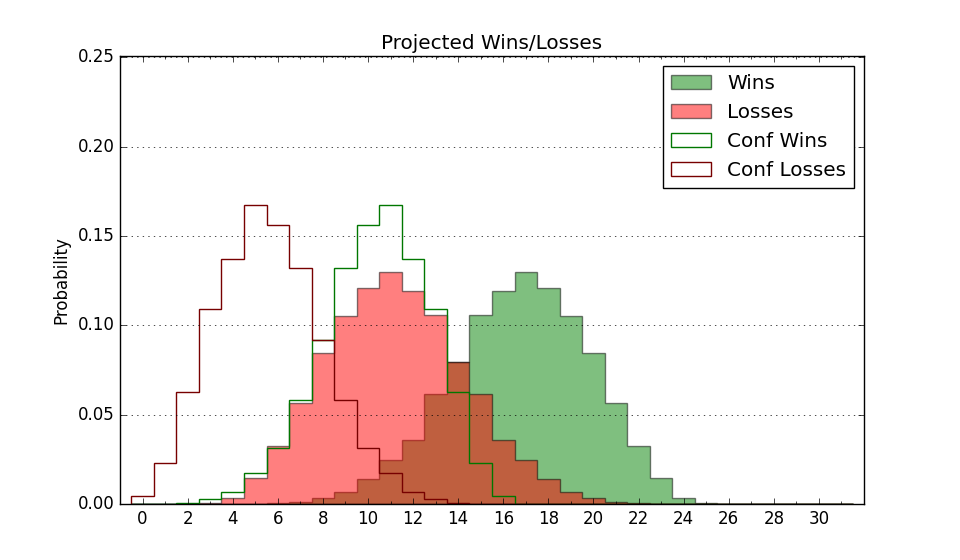
| Exp. Wins | 2.0 | -- | -- | +0.8 | -7.9 |
| Exp. Conf Wins | 2.0 | -- | -- | +0.8 | -4.5 |
| Conf Champ Prob | 0.0 | -- | -- | -- | -2.8 |
| Advanced Stats | ||
|---|---|---|
| Stat | Value | Rank |
| Off Eff FG % | 0.472 | 315 |
| Off Ast Ratio | 0.112 | 355 |
| Off ORB% | 0.227 | 349 |
| Off TO Rate | 0.175 | 343 |
| Off FT Ratio | 0.294 | 318 |
| Def Eff FG % | 0.580 | 356 |
| Def Ast Ratio | 0.179 | 350 |
| Def ORB% | 0.363 | 343 |
| Def TO Rate | 0.131 | 280 |
| Def FT Ratio | 0.327 | 131 |