12-18 (Overall)
Net: -5.2 (224th)
Off: 111.1 (145th)
Def: 116.3 (302nd)
SoR: 0.0 (97th)
| Home | Game Probabilities | Conferences | Preseason Predictions | Odds Charts | NCAA Tournament |
| City: | Elon, North Carolina | |
| Conference: | Colonial (11th)
| |
| Record: | 6-13 (Conf) 12-18 (Overall) | |
| Ratings: | Comp.: -5.2 (224th) Net: -5.2 (224th) Off: 111.1 (145th) Def: 116.3 (302nd) SoR: 0.0 (97th) |
| Remaining | ||||||
|---|---|---|---|---|---|---|
| Date | Opponent | Win Prob | Pred. | |||
| Previous | Game Score | |||||
| Date | Opponent | Win Prob | Result | Off | Def | Net |
| 11/8 | @UNC Greensboro (304) | 55.5% | W 92-90 | 3.3 | -1.8 | 1.5 |
| 11/12 | @Marshall (192) | 28.5% | L 89-96 | 2.9 | -1.1 | 1.8 |
| 11/15 | Gardner Webb (360) | 95.0% | W 95-84 | 1.8 | -10.1 | -8.2 |
| 11/20 | @Miami FL (31) | 3.2% | L 72-99 | 1.9 | -2.8 | -0.9 |
| 11/24 | @Appalachian St. (188) | 28.0% | W 88-53 | 32.4 | 29.1 | 61.5 |
| 11/29 | Mercer (183) | 56.2% | L 84-91 | -12.5 | -5.3 | -17.8 |
| 12/3 | Furman (195) | 58.0% | L 88-97 | 9.1 | -25.8 | -16.6 |
| 12/6 | @Wofford (253) | 42.0% | W 73-52 | 5.5 | 33.2 | 38.8 |
| 12/13 | Northern Illinois (337) | 89.3% | W 85-79 | 2.9 | -11.7 | -8.8 |
| 12/17 | Richmond (152) | 49.3% | W 73-70 | -2.8 | 9.9 | 7.1 |
| 12/20 | @Virginia Tech (56) | 6.5% | L 81-82 | 14.9 | 7.0 | 21.9 |
| 12/29 | Northeastern (280) | 77.4% | W 103-91 | 19.7 | -18.2 | 1.5 |
| 12/31 | College of Charleston (169) | 53.5% | L 81-85 | -1.8 | -5.2 | -7.0 |
| 1/8 | @North Carolina A&T (272) | 46.8% | W 69-64 | -12.6 | 20.2 | 7.7 |
| 1/10 | Campbell (203) | 60.4% | W 83-82 | 4.4 | -8.8 | -4.5 |
| 1/15 | @Northeastern (280) | 50.1% | L 78-85 | -10.2 | 5.1 | -5.2 |
| 1/17 | @Hofstra (93) | 11.4% | W 89-85 | 33.9 | -4.3 | 29.6 |
| 1/22 | Towson (155) | 49.8% | L 59-72 | -12.2 | -17.3 | -29.5 |
| 1/24 | @College of Charleston (169) | 25.3% | L 70-80 | -9.5 | 4.3 | -5.3 |
| 1/29 | William & Mary (134) | 44.2% | W 79-76 | 9.9 | 4.1 | 14.0 |
| 1/31 | Stony Brook (241) | 69.5% | L 68-72 | -15.1 | 5.2 | -9.9 |
| 2/5 | @Hampton (268) | 45.9% | L 79-87 | -8.9 | 1.7 | -7.1 |
| 2/7 | Drexel (217) | 64.2% | L 77-82 | 2.9 | -16.8 | -14.0 |
| 2/12 | @UNC Wilmington (107) | 14.1% | L 54-65 | -14.3 | 12.7 | -1.6 |
| 2/14 | @William & Mary (134) | 18.9% | W 81-78 | 9.2 | 12.0 | 21.1 |
| 2/21 | North Carolina A&T (272) | 75.0% | L 82-102 | 2.0 | -42.1 | -40.0 |
| 2/26 | @Towson (155) | 22.6% | L 56-58 | -8.8 | 22.3 | 13.4 |
| 2/28 | @Monmouth (164) | 24.6% | L 57-73 | -13.4 | 0.8 | -12.6 |
| 3/3 | UNC Wilmington (107) | 35.9% | L 57-76 | -23.8 | 2.7 | -21.2 |
| 3/7 | (N) William & Mary (134) | 30.0% | L 62-72 | -16.7 | 11.8 | -5.0 |
| Stats & Trends | |||||
|---|---|---|---|---|---|
| Current | Day | Week | Month | Season | |
| Composite | -5.2 | +0.0 | -0.2 | -1.2 | +5.6 |
| Comp Rank | 224 | -- | -5 | -17 | +50 |
| Net Efficiency | -5.2 | +0.0 | -0.2 | -1.3 | -- |
| Net Rank | 224 | -- | -5 | -17 | -- |
| Off Efficiency | 111.1 | +0.0 | -0.1 | -2.6 | -- |
| Off Rank | 145 | -- | -2 | -45 | -- |
| Def Efficiency | 116.3 | +0.0 | -0.1 | +1.3 | -- |
| Def Rank | 302 | -- | -1 | +15 | -- |
| SoS Rank | 208 | -- | -7 | +10 | -- |
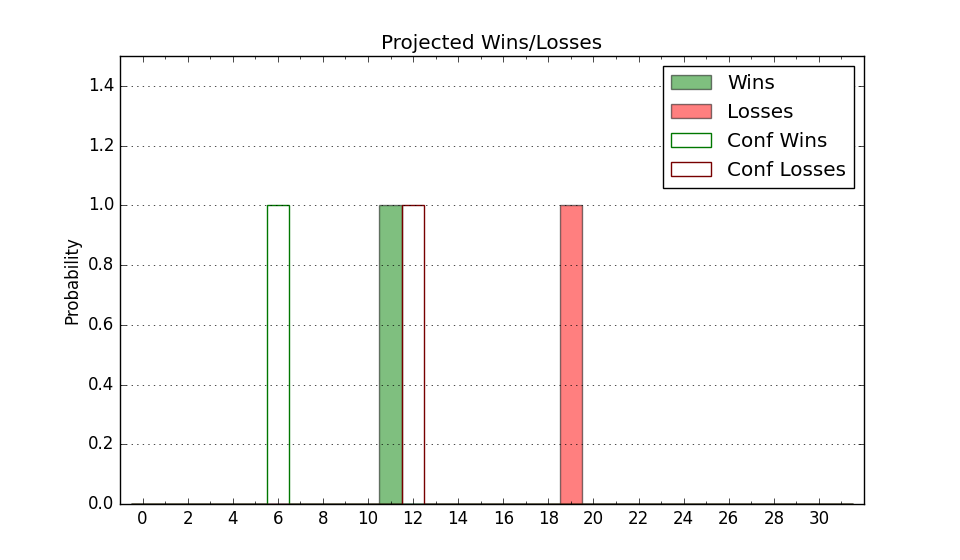
| Exp. Wins | 12.0 | -- | -- | -1.0 | +0.1 |
| Exp. Conf Wins | 6.0 | -- | -- | -1.0 | -1.7 |
| Conf Champ Prob | 0.0 | -- | -- | -- | -3.2 |
| Advanced Stats | ||
|---|---|---|
| Stat | Value | Rank |
| Off Eff FG % | 0.515 | 173 |
| Off Ast Ratio | 0.153 | 144 |
| Off ORB% | 0.320 | 124 |
| Off TO Rate | 0.144 | 172 |
| Off FT Ratio | 0.354 | 178 |
| Def Eff FG % | 0.549 | 302 |
| Def Ast Ratio | 0.168 | 318 |
| Def ORB% | 0.332 | 293 |
| Def TO Rate | 0.138 | 226 |
| Def FT Ratio | 0.329 | 137 |