17-12 (Overall)
Net: 1.6 (149th)
Off: 108.6 (177th)
Def: 107.0 (132nd)
SoR: 0.0 (97th)
| Home | Game Probabilities | Conferences | Preseason Predictions | Odds Charts | NCAA Tournament |
| City: | Philadelphia, Pennsylvania | |
| Conference: | Ivy League (2nd)
| |
| Record: | 11-5 (Conf) 17-12 (Overall) | |
| Ratings: | Comp.: 1.6 (149th) Net: 1.6 (149th) Off: 108.6 (177th) Def: 107.0 (132nd) SoR: 0.0 (97th) |
| Remaining | ||||||
|---|---|---|---|---|---|---|
| Date | Opponent | Win Prob | Pred. | |||
| Previous | Game Score | |||||
| Date | Opponent | Win Prob | Result | Off | Def | Net |
| 11/9 | @American (266) | 62.0% | L 78-84 | -6.6 | -3.3 | -10.0 |
| 11/11 | @Providence (64) | 13.7% | L 81-106 | -4.4 | -13.9 | -18.3 |
| 11/17 | Saint Joseph's (128) | 58.9% | W 83-74 | 2.0 | 2.8 | 4.8 |
| 11/21 | @Drexel (217) | 50.7% | W 84-68 | 25.0 | 4.0 | 29.0 |
| 11/28 | Merrimack (208) | 76.0% | W 77-65 | 5.6 | 4.5 | 10.1 |
| 11/29 | La Salle (248) | 82.3% | W 73-71 | 8.8 | -2.3 | 6.5 |
| 11/30 | Hofstra (93) | 46.1% | L 60-77 | -16.7 | -8.3 | -25.0 |
| 12/6 | @Villanova (40) | 8.0% | L 63-90 | -0.4 | -15.4 | -15.8 |
| 12/8 | Lafayette (323) | 92.4% | W 74-72 | -14.7 | -5.7 | -20.5 |
| 12/20 | @Rutgers (132) | 30.7% | L 69-70 | -0.2 | 8.0 | 7.7 |
| 12/28 | @George Mason (102) | 23.4% | L 79-83 | 13.6 | -9.8 | 3.9 |
| 12/31 | NJIT (331) | 93.5% | W 80-61 | -0.3 | 3.5 | 3.2 |
| 1/5 | @Princeton (252) | 58.5% | L 76-78 | 7.9 | -13.0 | -5.2 |
| 1/10 | Brown (295) | 88.8% | W 81-73 | 9.3 | -17.4 | -8.1 |
| 1/17 | @Dartmouth (275) | 64.0% | W 84-74 | 13.1 | 7.1 | 20.3 |
| 1/19 | @Harvard (160) | 36.7% | L 63-64 | -1.0 | 3.3 | 2.3 |
| 1/24 | Yale (82) | 41.1% | L 60-77 | -19.1 | 0.3 | -18.8 |
| 1/30 | @Columbia (186) | 43.0% | L 67-72 | -4.9 | 3.0 | -1.8 |
| 1/31 | @Cornell (151) | 35.6% | W 91-81 | 11.0 | 5.9 | 16.9 |
| 2/7 | Princeton (252) | 82.7% | W 61-60 | -8.7 | -4.6 | -13.3 |
| 2/13 | Columbia (186) | 72.0% | W 76-67 | -4.1 | 7.2 | 3.1 |
| 2/14 | Cornell (151) | 65.3% | W 82-76 | -13.4 | 12.5 | -0.9 |
| 2/21 | @Yale (82) | 17.0% | L 70-74 | 2.1 | 10.8 | 12.9 |
| 2/27 | Dartmouth (275) | 85.8% | W 80-71 | 1.6 | -3.9 | -2.2 |
| 2/28 | Harvard (160) | 66.4% | W 64-61 | -15.8 | 17.5 | 1.7 |
| 3/6 | @Brown (295) | 69.9% | W 82-61 | 10.7 | 12.7 | 23.3 |
| 3/14 | (N) Harvard (160) | 51.7% | W 62-60 | -17.0 | 17.1 | 0.1 |
| 3/15 | (N) Yale (82) | 27.5% | W 88-84 | 12.0 | -0.9 | 11.1 |
| 3/19 | (N) Illinois (4) | 2.6% | L 70-105 | 6.1 | -26.5 | -20.3 |
| Stats & Trends | |||||
|---|---|---|---|---|---|
| Current | Day | Week | Month | Season | |
| Composite | 1.6 | +0.0 | +0.1 | +1.0 | +10.9 |
| Comp Rank | 149 | -- | -- | +8 | +97 |
| Net Efficiency | 1.6 | +0.0 | +0.1 | +0.8 | -- |
| Net Rank | 149 | -- | -- | +6 | -- |
| Off Efficiency | 108.6 | +0.0 | +0.1 | +0.2 | -- |
| Off Rank | 177 | +1 | +1 | -3 | -- |
| Def Efficiency | 107.0 | +0.0 | +0.0 | +0.6 | -- |
| Def Rank | 132 | -- | -- | +11 | -- |
| SoS Rank | 159 | +1 | +3 | +12 | -- |
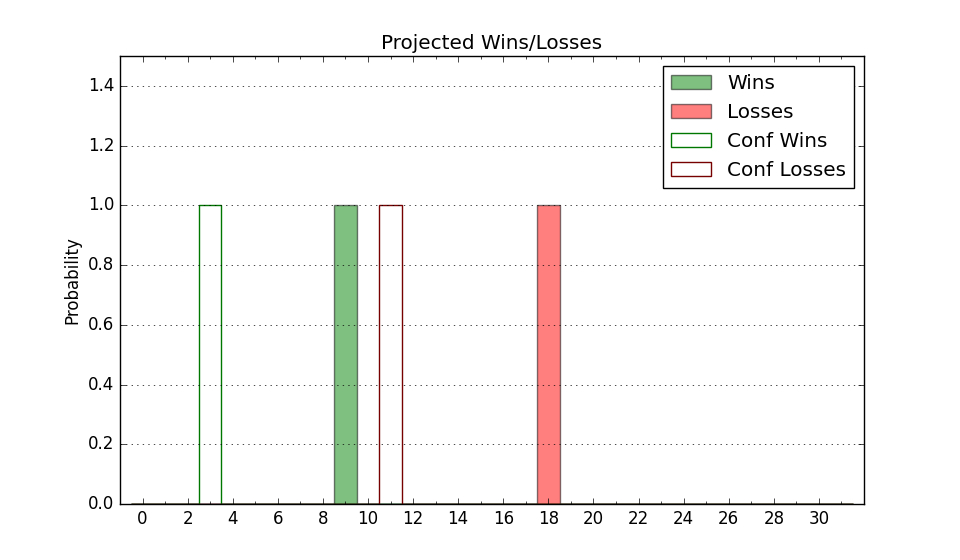
| Exp. Wins | 17.0 | -- | -- | +2.9 | +7.0 |
| Exp. Conf Wins | 11.0 | -- | -- | +2.9 | +5.7 |
| Conf Champ Prob | 0.0 | -- | -- | -0.2 | -3.2 |
| Advanced Stats | ||
|---|---|---|
| Stat | Value | Rank |
| Off Eff FG % | 0.509 | 191 |
| Off Ast Ratio | 0.147 | 179 |
| Off ORB% | 0.296 | 200 |
| Off TO Rate | 0.145 | 192 |
| Off FT Ratio | 0.365 | 150 |
| Def Eff FG % | 0.515 | 179 |
| Def Ast Ratio | 0.148 | 190 |
| Def ORB% | 0.312 | 215 |
| Def TO Rate | 0.141 | 216 |
| Def FT Ratio | 0.286 | 41 |