22-10 (Overall)
Net: 7.4 (102nd)
Off: 112.8 (113th)
Def: 105.4 (104th)
SoR: 0.0 (90th)
| Home | Game Probabilities | Conferences | Preseason Predictions | Odds Charts | NCAA Tournament |
| City: | Fairfax, Virginia | |
| Conference: | Atlantic 10 (5th)
| |
| Record: | 11-8 (Conf) 22-10 (Overall) | |
| Ratings: | Comp.: 7.4 (102nd) Net: 7.4 (102nd) Off: 112.8 (113th) Def: 105.4 (104th) SoR: 0.0 (90th) |
| Remaining | ||||||
|---|---|---|---|---|---|---|
| Date | Opponent | Win Prob | Pred. | |||
| Previous | Game Score | |||||
| Date | Opponent | Win Prob | Result | Off | Def | Net |
| 11/3 | Wofford (253) | 89.5% | W 70-46 | -17.7 | 29.0 | 11.3 |
| 11/7 | Winthrop (133) | 72.8% | W 96-90 | 8.7 | -9.6 | -0.9 |
| 11/15 | New Hampshire (343) | 97.1% | W 61-44 | -30.9 | 23.2 | -7.8 |
| 11/18 | Jacksonville (294) | 93.3% | W 79-57 | 2.0 | 9.0 | 11.0 |
| 11/24 | (N) Ohio (238) | 80.7% | W 92-69 | 13.3 | 0.7 | 14.0 |
| 11/25 | (N) Florida Atlantic (127) | 57.9% | W 74-65 | 19.5 | -1.3 | 18.2 |
| 11/29 | James Madison (223) | 86.3% | W 82-66 | 4.0 | -1.0 | 3.0 |
| 12/2 | Cornell (151) | 77.0% | W 99-81 | 8.3 | -3.3 | 5.0 |
| 12/6 | @Virginia Tech (56) | 19.5% | L 62-73 | -6.1 | 2.5 | -3.6 |
| 12/13 | Old Dominion (258) | 90.1% | W 73-61 | -18.5 | 9.8 | -8.7 |
| 12/21 | Loyola MD (328) | 95.8% | W 86-79 | 3.2 | -23.2 | -20.0 |
| 12/28 | Penn (149) | 76.6% | W 83-79 | 9.8 | -13.6 | -3.9 |
| 12/31 | @La Salle (248) | 70.8% | W 80-75 | 20.7 | -14.5 | 6.2 |
| 1/3 | Rhode Island (153) | 77.2% | W 61-50 | -9.8 | 19.0 | 9.2 |
| 1/7 | @Fordham (172) | 54.7% | W 67-58 | 2.5 | 8.4 | 10.9 |
| 1/10 | VCU (50) | 40.8% | W 86-80 | 20.3 | -10.4 | 9.9 |
| 1/13 | @Loyola Chicago (279) | 77.6% | W 82-74 | 16.7 | -15.6 | 1.1 |
| 1/19 | George Washington (90) | 59.2% | W 69-64 | -11.0 | 14.8 | 3.8 |
| 1/24 | @Rhode Island (153) | 49.9% | L 65-74 | 8.4 | -19.2 | -10.8 |
| 1/28 | Davidson (120) | 70.3% | W 60-52 | -8.1 | 13.2 | 5.1 |
| 1/31 | @St. Bonaventure (146) | 48.2% | W 77-73 | -3.6 | 7.5 | 4.0 |
| 2/4 | Duquesne (143) | 75.7% | L 65-71 | -15.8 | -10.7 | -26.5 |
| 2/7 | Saint Joseph's (128) | 71.8% | W 60-52 | -8.6 | 14.8 | 6.2 |
| 2/10 | @Richmond (152) | 49.8% | L 70-82 | -9.4 | -7.6 | -17.0 |
| 2/13 | @George Washington (90) | 29.9% | L 53-72 | -16.1 | -5.0 | -21.1 |
| 2/18 | Dayton (79) | 53.2% | L 67-82 | 2.4 | -26.9 | -24.4 |
| 2/25 | @Saint Joseph's (128) | 42.7% | L 63-81 | -3.9 | -18.1 | -22.0 |
| 2/28 | St. Bonaventure (146) | 76.0% | W 71-58 | 1.8 | 8.8 | 10.6 |
| 3/3 | @VCU (50) | 16.8% | L 65-70 | 4.5 | 1.9 | 6.4 |
| 3/7 | Saint Louis (32) | 28.5% | W 86-57 | 33.0 | 25.6 | 58.6 |
| 3/12 | (N) St. Bonaventure (146) | 63.2% | L 57-63 | -20.1 | 7.0 | -13.2 |
| 3/17 | Liberty (121) | 70.6% | L 71-77 | -5.9 | -14.0 | -20.0 |
| Stats & Trends | |||||
|---|---|---|---|---|---|
| Current | Day | Week | Month | Season | |
| Composite | 7.4 | +0.0 | -0.1 | +0.9 | +3.0 |
| Comp Rank | 102 | -- | -- | +10 | -- |
| Net Efficiency | 7.4 | +0.0 | -0.1 | +0.9 | -- |
| Net Rank | 102 | -- | -- | +10 | -- |
| Off Efficiency | 112.8 | +0.0 | -0.0 | +0.6 | -- |
| Off Rank | 113 | -- | -1 | +10 | -- |
| Def Efficiency | 105.4 | +0.0 | -0.0 | +0.3 | -- |
| Def Rank | 104 | -- | +1 | +9 | -- |
| SoS Rank | 160 | +1 | -- | +42 | -- |
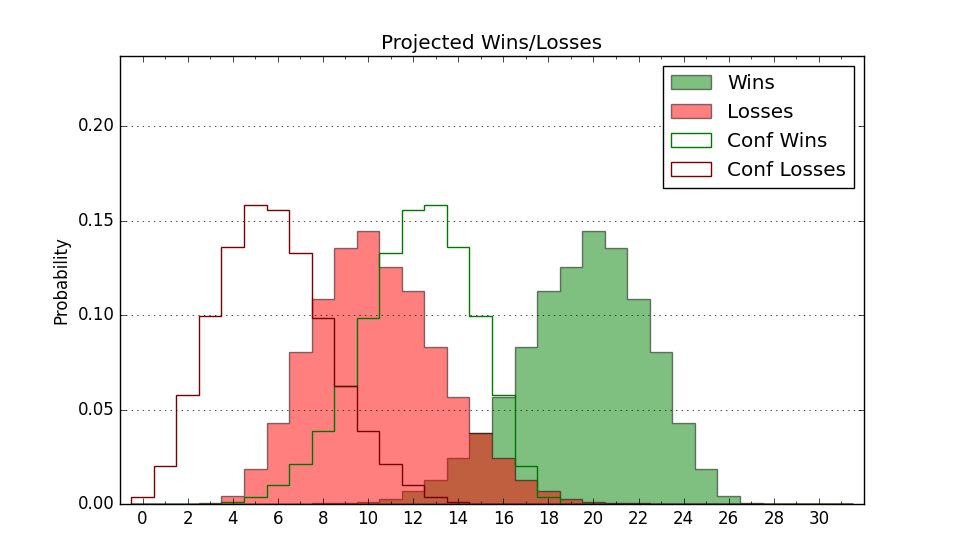
| Exp. Wins | 22.0 | -- | -- | +0.3 | +2.7 |
| Exp. Conf Wins | 11.0 | -- | -- | +0.3 | +0.7 |
| Conf Champ Prob | 0.0 | -- | -- | -- | -13.0 |
| Advanced Stats | ||
|---|---|---|
| Stat | Value | Rank |
| Off Eff FG % | 0.529 | 123 |
| Off Ast Ratio | 0.147 | 184 |
| Off ORB% | 0.318 | 135 |
| Off TO Rate | 0.139 | 132 |
| Off FT Ratio | 0.420 | 27 |
| Def Eff FG % | 0.488 | 87 |
| Def Ast Ratio | 0.144 | 157 |
| Def ORB% | 0.275 | 82 |
| Def TO Rate | 0.134 | 258 |
| Def FT Ratio | 0.286 | 42 |