7-24 (Overall)
Net: -11.4 (280th)
Off: 107.1 (205th)
Def: 118.6 (325th)
SoR: 0.0 (97th)
| Home | Game Probabilities | Conferences | Preseason Predictions | Odds Charts | NCAA Tournament |
| City: | Boston, Massachusetts | |
| Conference: | Colonial (13th)
| |
| Record: | 3-17 (Conf) 7-24 (Overall) | |
| Ratings: | Comp.: -11.4 (280th) Net: -11.4 (280th) Off: 107.1 (205th) Def: 118.6 (325th) SoR: 0.0 (97th) |
| Remaining | ||||||
|---|---|---|---|---|---|---|
| Date | Opponent | Win Prob | Pred. | |||
| Previous | Game Score | |||||
| Date | Opponent | Win Prob | Result | Off | Def | Net |
| 11/3 | Boston University (269) | 61.1% | L 75-76 | -19.8 | 11.5 | -8.3 |
| 11/7 | @Colgate (221) | 22.3% | W 68-65 | -8.3 | 22.5 | 14.2 |
| 11/11 | @Harvard (160) | 13.8% | W 77-60 | 14.4 | 30.1 | 44.5 |
| 11/15 | Vermont (244) | 55.8% | L 74-85 | -13.8 | -10.2 | -24.0 |
| 11/20 | @Princeton (252) | 28.0% | L 57-70 | -21.8 | 9.3 | -12.5 |
| 11/22 | (N) Duquesne (143) | 20.7% | W 93-86 | 5.7 | 17.3 | 23.0 |
| 11/28 | @Wake Forest (65) | 4.3% | L 73-86 | 0.2 | 10.7 | 10.9 |
| 12/3 | @Holy Cross (330) | 51.9% | L 59-76 | -24.5 | -3.2 | -27.7 |
| 12/7 | Central Connecticut (306) | 70.4% | W 73-56 | -8.9 | 29.9 | 20.9 |
| 12/20 | @Syracuse (83) | 5.5% | L 83-91 | 20.2 | -8.1 | 12.1 |
| 12/22 | @Rhode Island (153) | 13.4% | L 77-85 | 21.4 | -15.0 | 6.5 |
| 12/29 | @Elon (224) | 22.6% | L 91-103 | 18.2 | -19.7 | -1.5 |
| 12/31 | @North Carolina A&T (272) | 32.1% | W 85-74 | 18.5 | 0.8 | 19.3 |
| 1/3 | @Campbell (203) | 19.5% | L 82-97 | 6.4 | -12.4 | -6.0 |
| 1/8 | UNC Wilmington (107) | 23.2% | L 78-87 | 4.2 | -0.8 | 3.4 |
| 1/10 | Towson (155) | 34.8% | L 78-87 | 7.8 | -18.8 | -11.0 |
| 1/15 | Elon (224) | 49.9% | W 85-78 | -5.1 | 10.2 | 5.2 |
| 1/19 | @Monmouth (164) | 15.0% | L 68-81 | -8.3 | 2.0 | -6.4 |
| 1/22 | Stony Brook (241) | 55.1% | L 80-95 | -0.7 | -25.4 | -26.1 |
| 1/24 | @Drexel (217) | 22.1% | L 78-83 | 11.1 | -6.6 | 4.4 |
| 1/31 | College of Charleston (169) | 38.3% | L 84-89 | 15.9 | -14.2 | 1.7 |
| 2/5 | @Hofstra (93) | 6.5% | L 63-80 | -4.1 | 4.4 | 0.3 |
| 2/7 | @Stony Brook (241) | 26.5% | L 55-69 | -22.6 | 14.4 | -8.1 |
| 2/12 | William & Mary (134) | 29.9% | L 67-94 | -12.1 | -17.6 | -29.7 |
| 2/19 | Drexel (217) | 49.1% | L 61-70 | -16.1 | 3.5 | -12.6 |
| 2/21 | Hofstra (93) | 19.1% | L 68-82 | 0.3 | -10.7 | -10.4 |
| 2/26 | @William & Mary (134) | 11.1% | L 77-84 | -6.8 | 16.6 | 9.9 |
| 2/28 | @Hampton (268) | 31.4% | L 65-76 | -9.1 | -3.4 | -12.5 |
| 3/3 | Monmouth (164) | 37.5% | L 83-89 | 16.7 | -21.6 | -4.9 |
| 3/6 | (N) North Carolina A&T (272) | 46.6% | W 88-72 | 8.4 | 11.1 | 19.5 |
| 3/7 | @Drexel (217) | 22.1% | L 77-84 | 11.7 | -9.2 | 2.5 |
| Stats & Trends | |||||
|---|---|---|---|---|---|
| Current | Day | Week | Month | Season | |
| Composite | -11.4 | +0.0 | -0.2 | +0.1 | -3.2 |
| Comp Rank | 280 | -- | -2 | +8 | -53 |
| Net Efficiency | -11.4 | +0.0 | -0.2 | +0.1 | -- |
| Net Rank | 280 | -- | -2 | +8 | -- |
| Off Efficiency | 107.1 | +0.0 | -0.1 | +0.8 | -- |
| Off Rank | 205 | -- | -2 | +14 | -- |
| Def Efficiency | 118.6 | -0.0 | -0.1 | -0.7 | -- |
| Def Rank | 325 | -- | -1 | -5 | -- |
| SoS Rank | 190 | -- | -1 | -12 | -- |
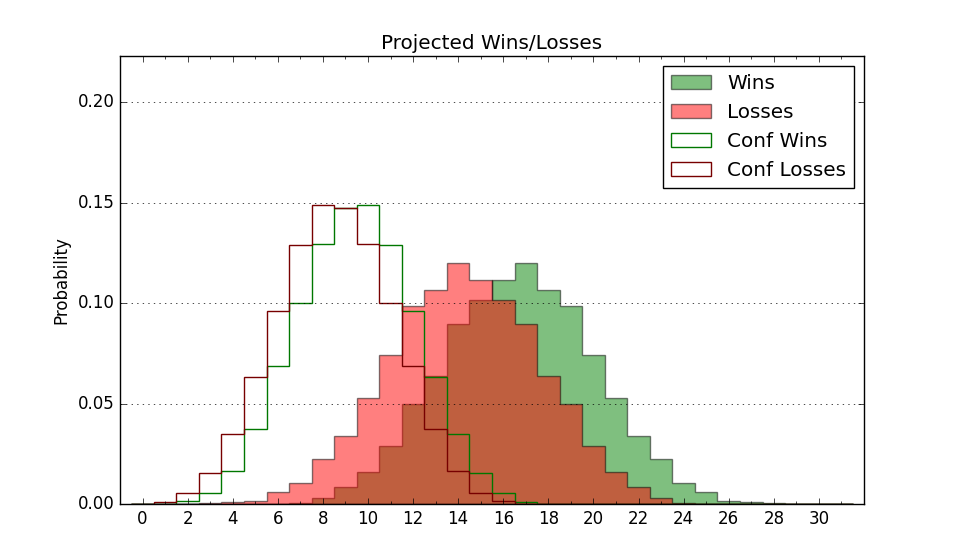
| Exp. Wins | 7.0 | -- | -- | +0.2 | -6.0 |
| Exp. Conf Wins | 3.0 | -- | -- | +0.2 | -5.8 |
| Conf Champ Prob | 0.0 | -- | -- | -- | -7.0 |
| Advanced Stats | ||
|---|---|---|
| Stat | Value | Rank |
| Off Eff FG % | 0.523 | 145 |
| Off Ast Ratio | 0.161 | 96 |
| Off ORB% | 0.269 | 272 |
| Off TO Rate | 0.152 | 242 |
| Off FT Ratio | 0.302 | 300 |
| Def Eff FG % | 0.572 | 345 |
| Def Ast Ratio | 0.159 | 264 |
| Def ORB% | 0.308 | 197 |
| Def TO Rate | 0.143 | 201 |
| Def FT Ratio | 0.420 | 318 |